Articles from:November 2018

  • Alumni profile: Sarah Lepp

    Geography alumna, Sarah Lepp (BSc Physical Geography ’13), was recently featured in Niagara College’s Research and Innovation News. Read more below.

    Profile: Sarah Lepp
    Sarah Lepp:Profile

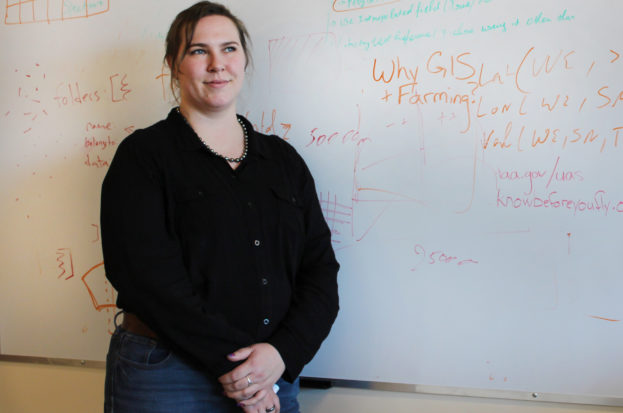
    Like many, Sarah Lepp was bored in her high school geography class – not realizing until university that it did not have to be all about memorizing capital cities and world atlases.

    While the St. Catharines native had always hiked in Short Hills Provincial Park, the discipline of Physical Geography at Brock gave her fresh eyes and a renewed appreciation for how the landscape was defined tens of thousands of years ago by glaciers and today by the physiographic variations.

    She’s the type always inspired by both peculiarities and patterns so it wasn’t surprising she became involved in the study of fluviomorphology, the phenomena of how water carves out a new natural integrity. It would be the first of many proficiencies to come.

    “Being out in nature has always and still does make me happy and peaceful; I always wanted everyone to have experiences like this.” It was in an effort to help keep the integrity of the environment that drew her initially to Niagara College some 15 years ago for a diploma in Environmental Technician Field/Lab before her foray into geography for a Bachelor of Science degree.

    Yet geographers are a curious bunch; they need to make sense of the world, understand how things change over time and how this knowledge could help others. Still looking to find her own place in the world, Sarah arrived back at NC’s Research & Innovation division a decade ago and worked her way to Senior Research Associate while cultivating her own path.

    Through her work at the Agriculture & Environmental Technologies Innovation Centre (AETIC), she has become highly valued in the agricultural industry for her expertise in geographic information systems (GIS), field topography dataset analysis, precision agriculture data quality, and something called phytogeomorphometrics, the study of how plants interact with the land surface (the research team has done extensive work with quantifying landforms and how crop and crop health changes with landform types).

    Continue reading Sarah’s profile here.

    Tags: , ,
    Categories: News

  • Geography alumna Diana Aquino wins Niagara Young Professional Award

    Diana Aquino (Geography Alumni) wins Women in Business award from GNCC

    Photo from Women In Niagara (@GNCC_WIN) on Twitter.

    The Department of Geography and Tourism Studies is pleased to congratulate Geography alumna Diana Aquino, Walker Environmental Group, on winning the 2018 Greater Niagara Chamber of Commerce Women in Business Young Professional Award.

    The Women in Business Awards (WIBA) is an annual event to recognize the leadership and success of women in the Niagara business community.

    Tags: , ,
    Categories: News

  • Brock student wins two awards in national science photo competition

    Dana Harris calls Nov. 9 her “special day.”

    It was on that day last week that the Master of Sustainability student became a first time aunt, and also the day she was told, in the strictest of confidence, that she had captured two top prizes in a national science research photo competition.

    Harris had to keep the secret of her achievement under wraps until Nov. 14, when the Natural Sciences and Engineering Research Council of Canada (NSERC) announced the winners of its Canada-wide Science Exposed competition.

    The competition showcases images taken during scientific research being conducted in all fields by faculty and student researchers in post-secondary institutions and researchers in public and private research centres.

    Dana Harris photo submission

    Dana Harris’ submission to the NSERC Science Exposed competition
    featuring cells of the jack pine tree.

    Harris received the People’s Choice Award and a Jury Prize for her photo, “Exploring the Jack Pine Tight Knit Family Tree.”

    “It’s a super huge honour to have people sharing my photo, voting on it and just enjoying it,” says Harris. “And, to get that mention from the NSERC jury members was really gratifying.”

    Diane Dupont, Dean of Graduate Studies, said the Faculty is “so proud of Dana and her success in the NSERC Science Exposed photography contest.”

    “To win the People’s Choice Award is an outstanding achievement,” Dupont said. “This award is a testament to the cutting-edge research she is pursuing involving the globally-relevant topic of climate change.”

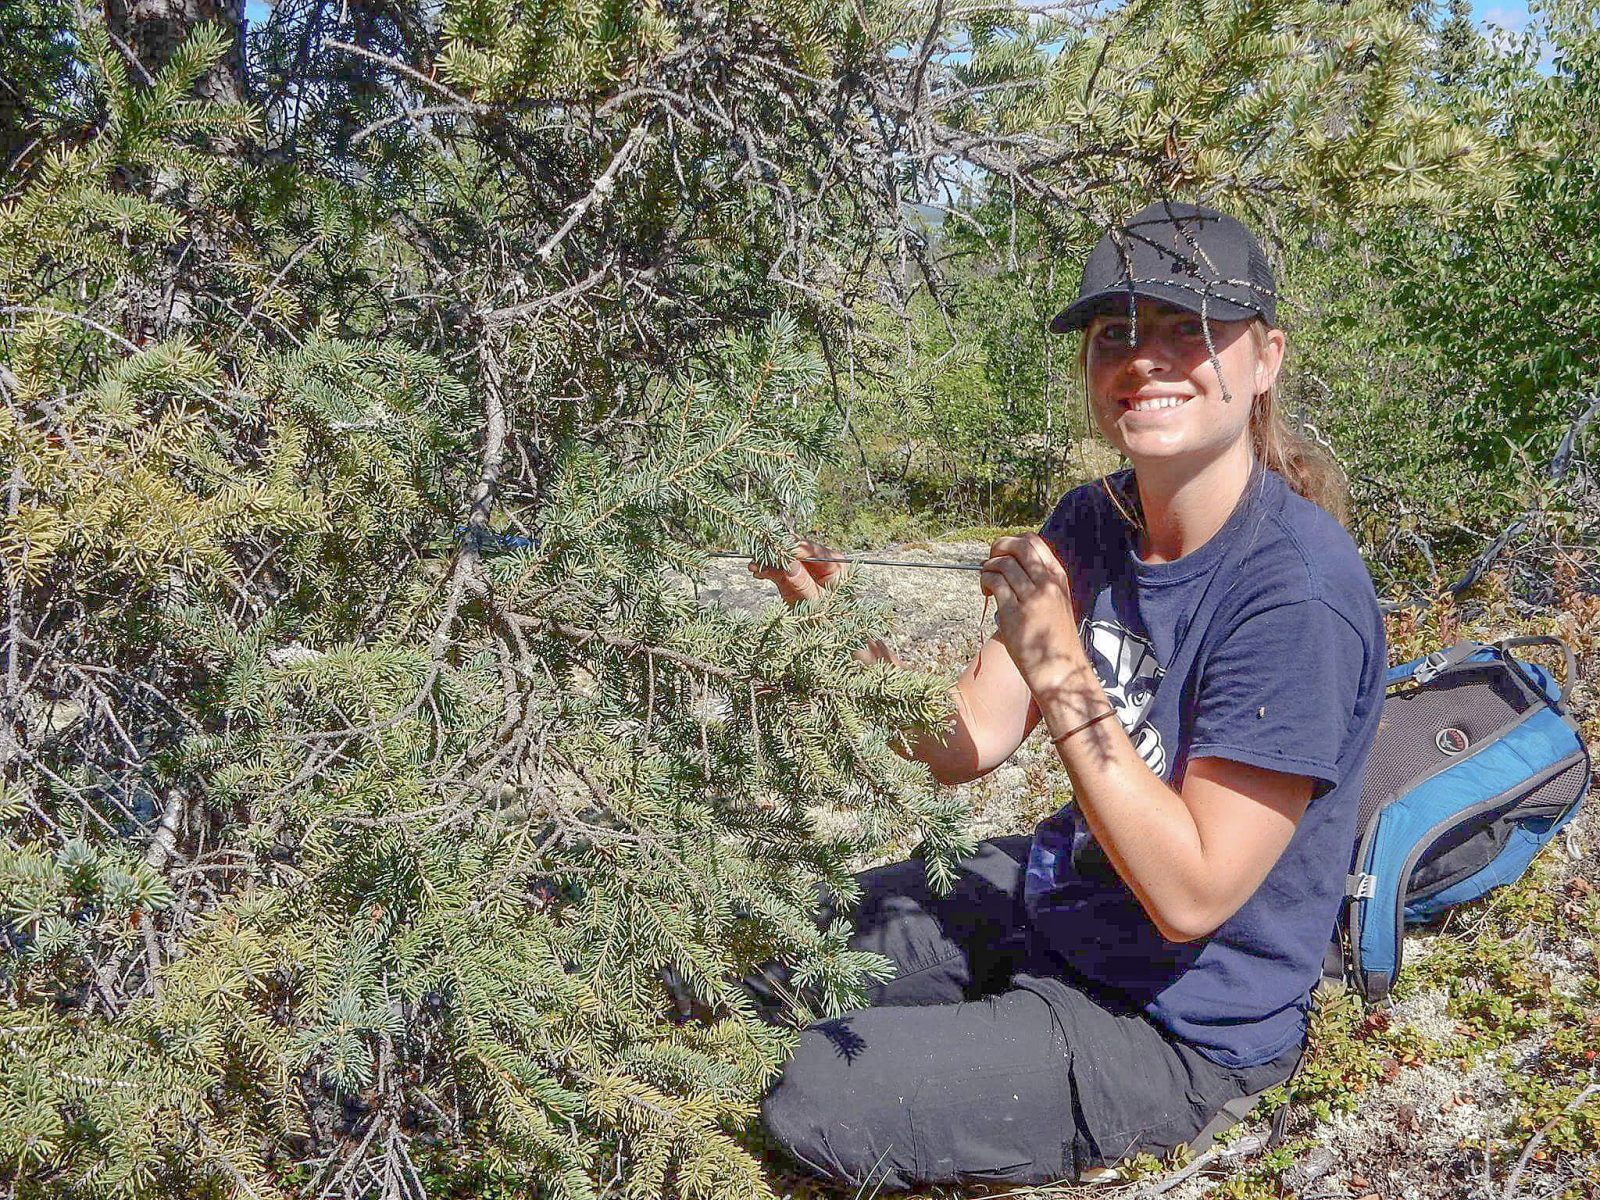
    Harris’ photo shows phases of developing xylem cells, stained in different colours, that are found in a wood sample cored from the outermost part of a jack pine tree in the Northwest Territories, where she is from.

    The image, shot from a microscope, shows the jack pine tree’s phloem, cambial and xylem cells (blue dye) and mature xylem cells (red dye) in a thin slice of the wood. It is one of a series of images taken weekly over the past year to track the growth of the jack pine tree’s various cells.

    “This type of information is useful for researchers who create climate reconstructions using tree rings as a source of historical climate data,” explains Harris.

    She thanked her supervisor, Professor of Geography and Tourism Studies Michael Pisaric, and her fellow student researchers in Brock’s Water and Environment Laboratory (WEL) for their support.

    “Dana’s research is helping to understand how important tree species in the boreal forest are affected by climate change,” says Pisaric. “Her research also helps to inform larger questions concerning carbon uptake by the boreal forest.

    “Northern regions of Canada are being impacted by changing climatic conditions, including warmer temperatures, changing precipitation regimes and altered frequency and intensity of forest fires and other disturbance agents.”

    The WEL lab is co-directed by Pisaric and Associate Professor of Geography and Tourism Studies Kevin Turner, with the aim to explore how terrestrial and aquatic ecosystems in Canada’s North are changing in response to climatic and environmental change.

    Harris says she is happy that research on climate change and environmental conditions in the North were acknowledged with awards in the competition.

    Earlier this year, the photos of 20 researchers from across Canada, including Harris’s entry, were shortlisted and posted on NSERC’s website. People viewing the 20 photos were given the chance to vote for their favourite image. A panel of judges also chose three images that won jury prizes.

    Harris was also a competitor in NSERC’s Science, Action! research video contest,making the first cut of the three-round competition with her video “Jack Pine Growth, NT.”

    NSERC is Canada’s federal funding agency for university-based research, supporting faculty and students through a number of awards. In the most recent round of funding, 18 faculty researchers and nine students received a total of $3.2 million.

    Story reposted from The Brock News.

    Tags: , , , , , ,
    Categories: News

  • Jeff Boggs participates in the 2018 Niagara Economic Summit panel on Tomorrow’s Reality

    Profesor Jeff Boggs (third from left) participates in the Niagara Economic Summit 2018 panel on Tomorrow’s Reality. Photo by Brock NCO.

    On November 2, 2018, professor Jeff Boggs joined five other panelists to discuss “Tomorrow’s Reality — Trends to Watch For”. The panel explored the contemporary global demographic and economic trends and considered their implications for Niagara, most importantly their effects on our competitiveness in the global market.

    The Niagara Economic Summit brings together individuals from across the Region to celebrate shared successes, strategize the way forward for our regional economy, and increase collaboration. Participants from academy, senior ranks of government, economists, organizational leaders and business owners explore the importance and opportunities presented by diversification.

    More information about the event can be found at gncc.ca/economicsummit/.

    Tags: , ,
    Categories: News

  • Mapping Wins and Losses on the Rink: A GIS Approach to Ice Hockey Analytics

    Story from the Esri Canada Blog, November 1, 2018

    Contributed by Kyle Rankin (Brock GEOG ’18), Associate GIS Analyst, Esri Canada

    Like many Canadians, I like to watch Hockey Night in Canada every week, which is where I got the idea of applying GIS to analyze hockey. In the months that followed, not only did I apply spatial analysis to hockey games, but I also submitted this analysis to apply for the Esri Canada Higher Education GIS Scholarship at Brock University.  Find out what made this a winning project.

    November 14 is GIS Day, celebrated by geographers, cartographers and GIS users everywhere. At Brock University, GIS students celebrate with a project competition sponsored by Esri Canada. The winner receives an Esri Canada Higher Education GIS Scholarship, which includes funding, software, training and networking opportunities to help students continue to develop their GIS skills and interests. I decided to work on a project applying GIS analysis to hockey games and submit it for the competition.

    As Canadians, we all know what hockey means to us: passion, athleticism, power and toughness––a hockey player is as Canadian as the maple syrup. For many people, myself included, the game of hockey doesn’t mean advanced regression models and mathematical formulas. However, this changed for me when I realized there was an opportunity to apply the power of GIS and Esri’s spatial analysis tools to analyze hockey.

    Every hockey team wants to understand how they can score more goals than their opponent and win more hockey games. If you are a hockey player, you’d more than likely agree this has as much to do with location on the ice during a game as an individual player’s talent. As a young hockey player, I was constantly taught where to skate to, where to shoot from and where to defend from. That’s applying the science of where to hockey!

    Locational understanding on the hockey rink is clearly evident. So, I formulated the basic question for applying spatial analysis to player and team performance: what datasets are needed and can be analyzed to help hockey teams increase their goal-scoring and ultimately improve their chances of winning a match?

    To expand on this, three questions came to mind:
    a) What kind of data would be easiest to collect and yield the best quality result? (Shot locations, player locations, puck location, etc.)
    b) How could I define areas on the ice that are associated with higher likelihoods of scoring?
    c) How can the fast and fluid game of hockey be analyzed using hard-defined areas?

    Armed with these questions, I approached the Brampton Beast professional hockey team’s manager of hockey operations, who showed great interest in my project and agreed to collaborate with me. Together, we set out to study the location where shots were taken on the ice to conduct statistical analysis. The report I created were not only easy to read and understand, but also provided meaningful insight into the team’s games.

    Data-Driven, Evidence-Based Reports

    Using data collected from the East Coast Hockey League (ECHL) online game centre , I digitized 705 points representing the location of shots for and against Brampton during 10 of their games. I relied on ArcGIS ModelBuilder to create a repeatable workflow for querying and analyzing the data. This allowed for reports to be created with ease, as the model pulled data that matched certain criteria and then performed analyses, such as kernel density, to highlight hot spots in shot-activity on the ice. I created several reports that were based on individual player performance, single games, certain opposing goalies and comparison charts of games won versus games lost.

    The team’s staff used these reports to gain a better understanding of the strengths and weaknesses of their strategy and to adjust their game-day strategy accordingly. Such reports can enhance coaching practices with data-driven and evidence-based strategies. Especially knowing how fast-moving and fluid hockey is––for example, while nobody can tell Sidney Crosby the exact coordinates of where he should shoot from, if you give him a map showing that he scores more often from the middle section of the ice than anywhere else, then he’ll be out there in the next shift doing just that. Using these reports to interact with players can help them better understand their statistics and the analysis of their play––looking at a cool map is a lot easier to understand than numbers on a spreadsheet.

    The home plate is right at the centre of the ice in the attacking zone, where most goals and high-quality scoring opportunities occur. Shots from the home plate are more likely to result in goals, which implies that if teams focus on shooting from here, they are more likely to win. The Beast’s staff identified this as a significant revelation––they decided to concentrate on making offense from the home plate, while also channelling their defensive strategies on preventing opponent shots within this area inside the blue line.

    Continue reading Kyle’s post on the Esri Canada Blog.

    Tags: , , , ,
    Categories: News

  • Student-led Datathon dives deep into growing industry

    Big data is big business — and where big career opportunities lie.

    To introduce their peers to the growing field of data analytics, a group of Brock University students has created an event that dives into the data phenomenon.

    Now in its second year, the Datathon Educational Conference takes place at Brock University on Saturday, Nov. 10 and features a series of presentations and workshops from industry experts.

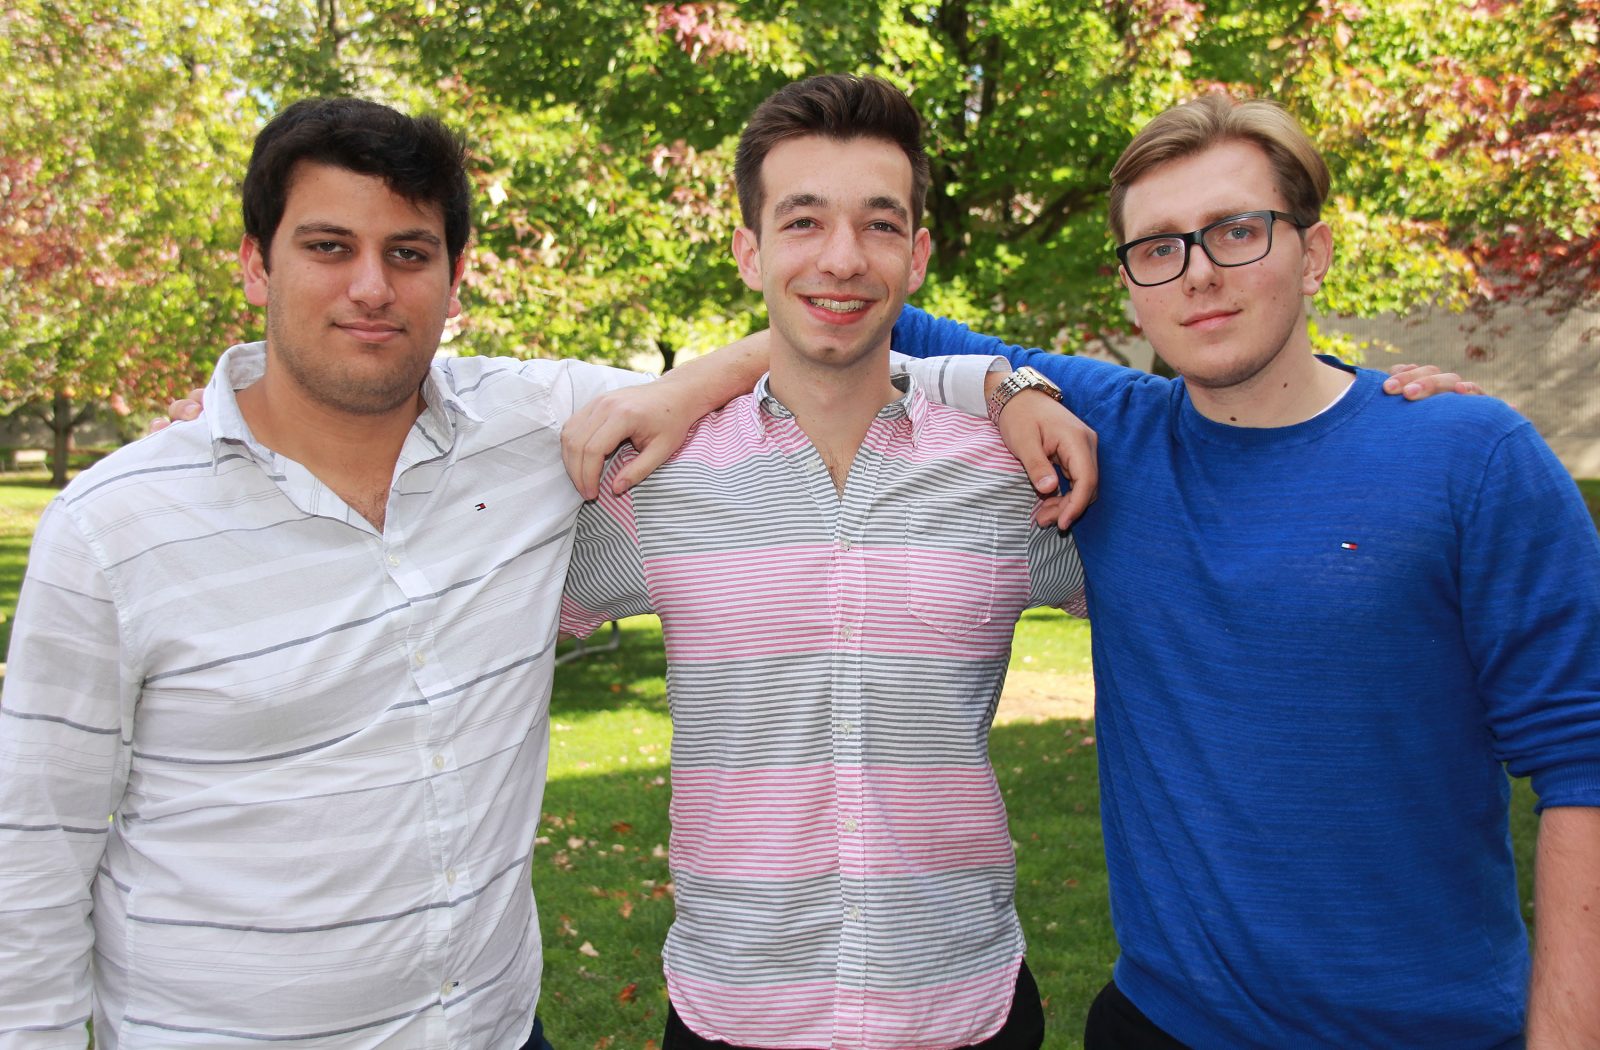
    “We’re bigger and better in almost every regard,” said third-year Political Science student Nour Hage, who co-founded the event alongside Conrad Lipiec and Thomas Lillo. “We have a lineup of great executives coming in from some of the biggest and best companies in Canada, including Microsoft, RBC, CIBC, Deloitte and BMO.”

    The event’s roster includes speakers from a variety of backgrounds, such as health sciences, finance, law and digital humanities, as well as experts from several “up-and-coming startups who have big contracts with multinational firms like Apple,” said Lipiec, a third-year Economics student.

    The Datathon, which sold out in its inaugural year, is about connecting students with industry leaders and helping to guide them on a path to data proficiency, he said.

    Workshops held throughout the day were developed through discussions with industry insiders about what they look for in workers in terms of preferred skills.

    By developing those applicable skills, the goal is to help students gain co-op opportunities and “hit the ground running,” Lipiec said.

    Hage stressed there’s “no experience required” to take the Datathon plunge, as it caters to beginners as well as those who have a keen interest in the topic.

    “In university, all we do is analyze information; we manipulate it, make use of it and create new information with existing information,” said Lillo, a third-year Geography and Computer Science student, who encouraged students not to shy away. “That’s all analytics is, but with technology added into the mix.”

    Datathon organizers hope to open the eyes of students from various programs to the possibilities that exist with analytics.

    “We want to show people this is not just for Computer Science and Business students,” Lipiec said. “There are new data case studies coming out every day in fields you wouldn’t expect, like human resources and accounting. It’s such an innovative field.”

    Lillo said analytics, especially the tools being focused on at the conference, are “really applicable to every domain.”

    “It’s only going to become more important as technology continues to improve.”

    The Datathon’s main sponsor is Brock’s Goodman School of Business. The event, held in Sean O’Sullivan Theatre, will include opening remarks by University President Gervan Fearon.

    Combined tickets for the conference and related workshops are $29, and conference-only tickets are $19.

    For more information and a full list of workshops and speakers, visit datathon.ca.

    Story reposted from The Brock News.

    Tags: ,
    Categories: News