Articles tagged with: GIS

  • Data shows eclipse’s weather impact

    Brock University Associate Professor Kevin Turner and Microcomputer Support Analyst/Technician Dimitre Iankoulov from the Department of Geography and Tourism Studies collected temperature, humidity, wind speed and shortwave radiation data using a scientific weather station during the April 8 eclipse. Turner compared the data with other local stations and confirmed that the temperature dropped by about three degrees Celsius and the wind speed climbed several kilometres per hour as the eclipse went into totality. Turner says that although the numbers do not seem dramatic, the fast pace at which it happens is captivating and triggers our human response. “The experience and observations are reminders of stellar processes and interactions that are much bigger than us or anything we can control,” he says.

    Tags: , , , , , , , , ,
    Categories: News

  • Geomatics minor helps students tackle environmental problems using tech

    With increasing demand for data-driven decision-making, including identifying the impacts of climate and environmental change, effective use of monitoring technologies such as remote sensing and geographic information systems (GIS) is a valuable skillset.

    As Geography Awareness Week continues, and Brock joins institutions from around the world in marking GIS Days, Professor Michael Pisaric hopes that students will explore the many opportunities to engage with GIS at Brock, from the resources in the Map, Data and GIS Library to the Geomatics minor offered in the Department of Geography and Tourism Studies.

    Pisaric says that demand for expertise in geomatics has increased in part due to technological advances, such as incorporating artificial intelligence to support analysis and modelling.

    He believes that the Geomatics minor offered by the Department of Geography and Tourism Studies supports students who want to “deploy their knowledge and skills in using geospatial technologies to address urgent problems related to climate and environmental change.”

    “The United Nations estimates that 1.2 billion jobs globally depend on a stable and healthy environment in sectors such as agriculture, fisheries, forestry and tourism,” says Pisaric. “Geomatics plays a key role in each of these sectors by providing a toolset to gather, process and analyze vast amounts of spatial data to model and predict how ecosystems will respond to pressing environmental issues.”

    Associate Professor of Earth Sciences Kevin Turner says that tracking spatial patterns using geomatics helps support decision-makers both locally and globally, whether the data collected pertains to environmental phenomena like deglaciation and sea level rise or to human systems like transportation networks.

    He notes that students in Brock’s geomatics courses have an opportunity to apply their learning to issues and regions that matter most to them.

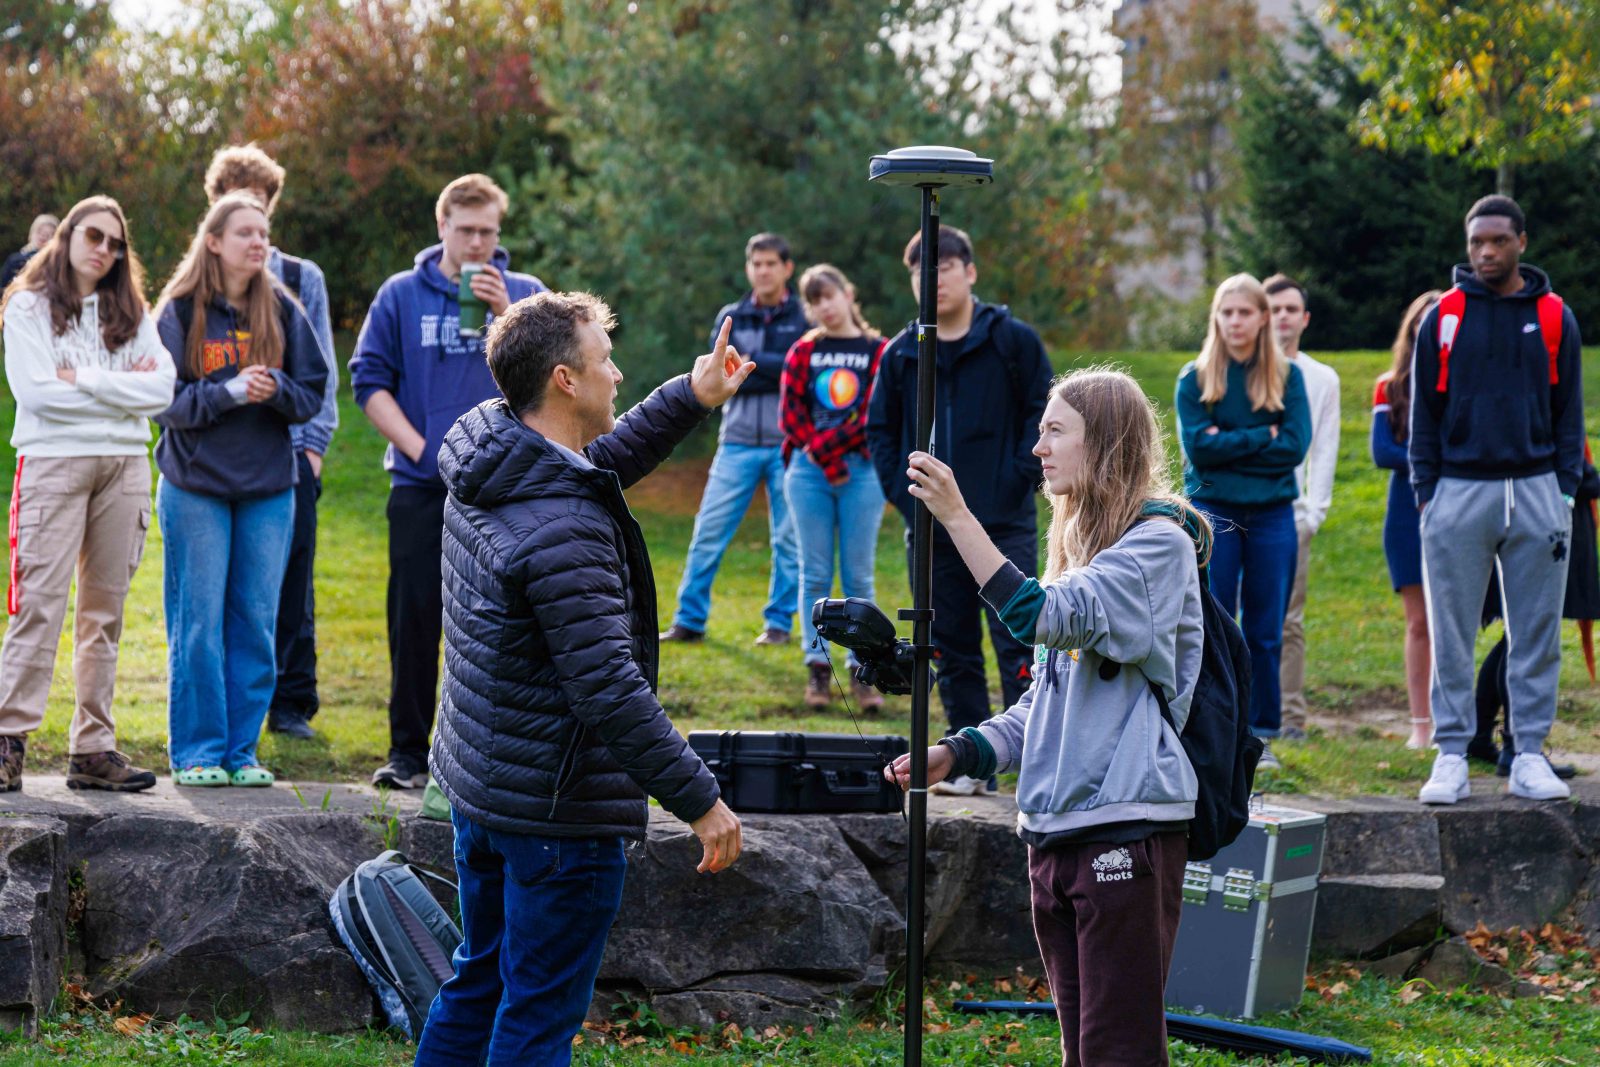
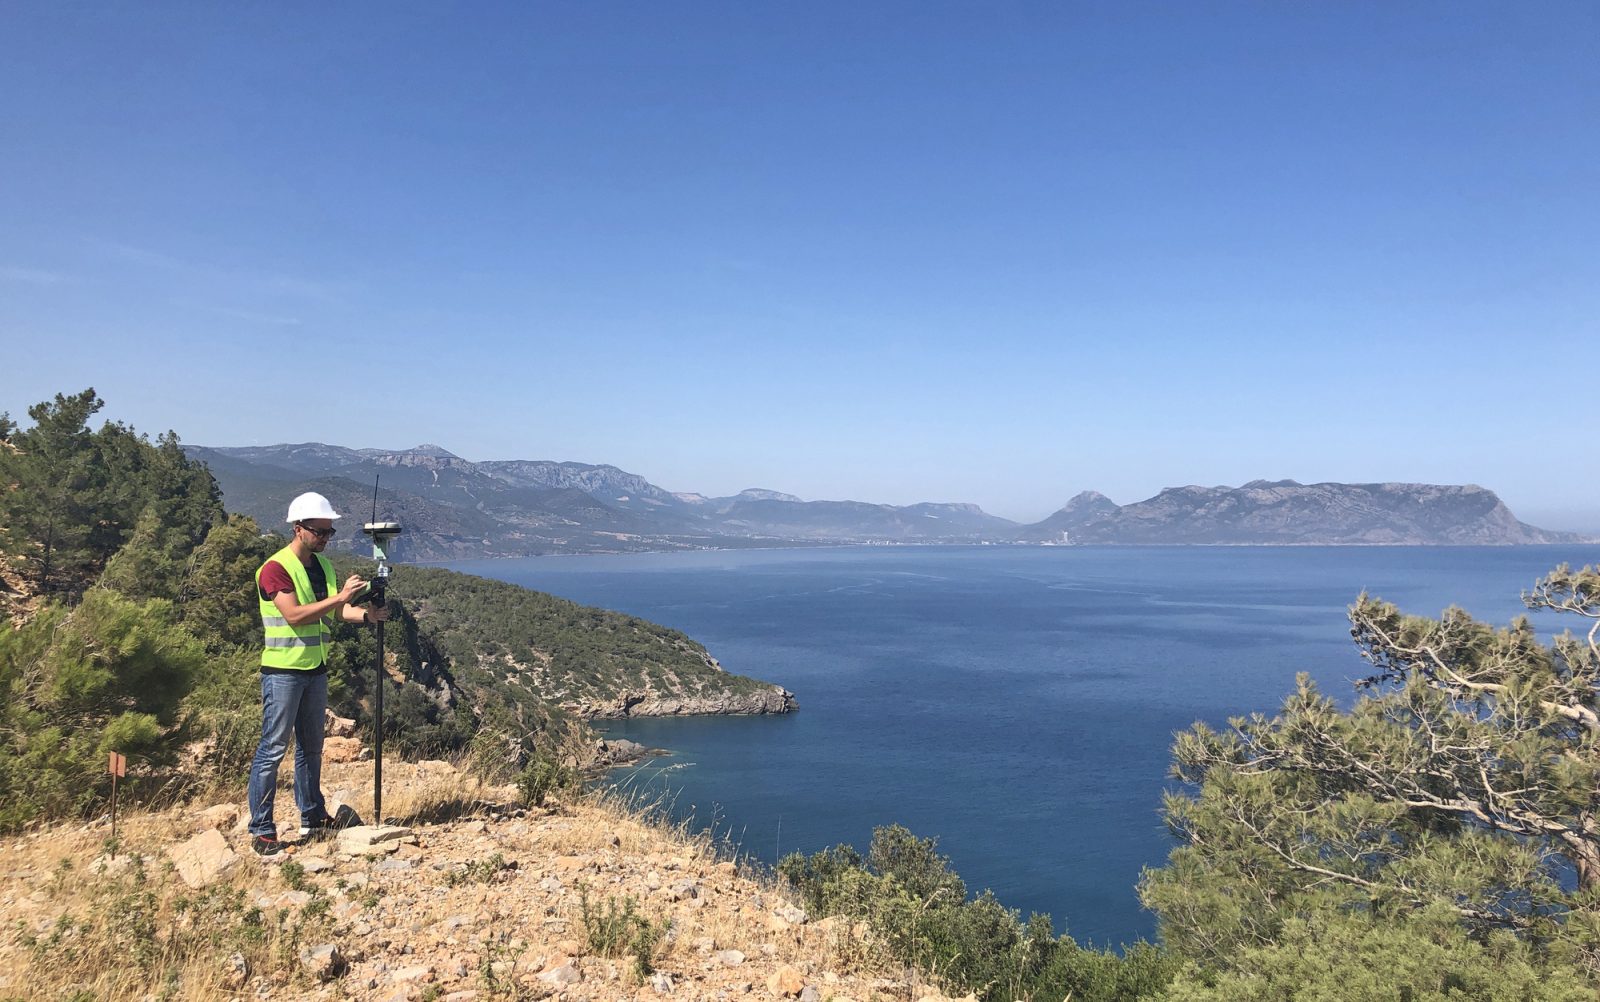
    “Students can learn to utilize leading-edge software and geospatial data acquisition tools, including differential GPS, LiDAR and drones, to support their own research interests,” says Turner. “Students with this kind of training are highly sought after for employment in public and private sectors as well as academic institutions.”

    Anyone interested in learning more about the Geomatics minor can learn more on the web and contact the department for more details.

    Story reposted from The Brock News.

    Tags: , , , , ,
    Categories: News

  • Opportunities for study, work in growing field of geomatics

    From The Brock NewsTHURSDAY, JANUARY 12, 2023 | by 

    The demand for skilled employees in geospatial technologies is growing — and so is Brock’s reputation for preparing students for employment in the field.

    With many students at the University training in geomatics, the outside world — including the Canadian Hydrographic Services (CHS) — is taking notice.

    Part of the Government of Canada, the CHS is responsible for ensuring the safe navigation of Canada’s waterways by surveying and making mapping products for use by commercial navigators and recreational boaters.

    Representatives from the organization will visit campus next week to speak with Geomatics students about potential employment opportunities.

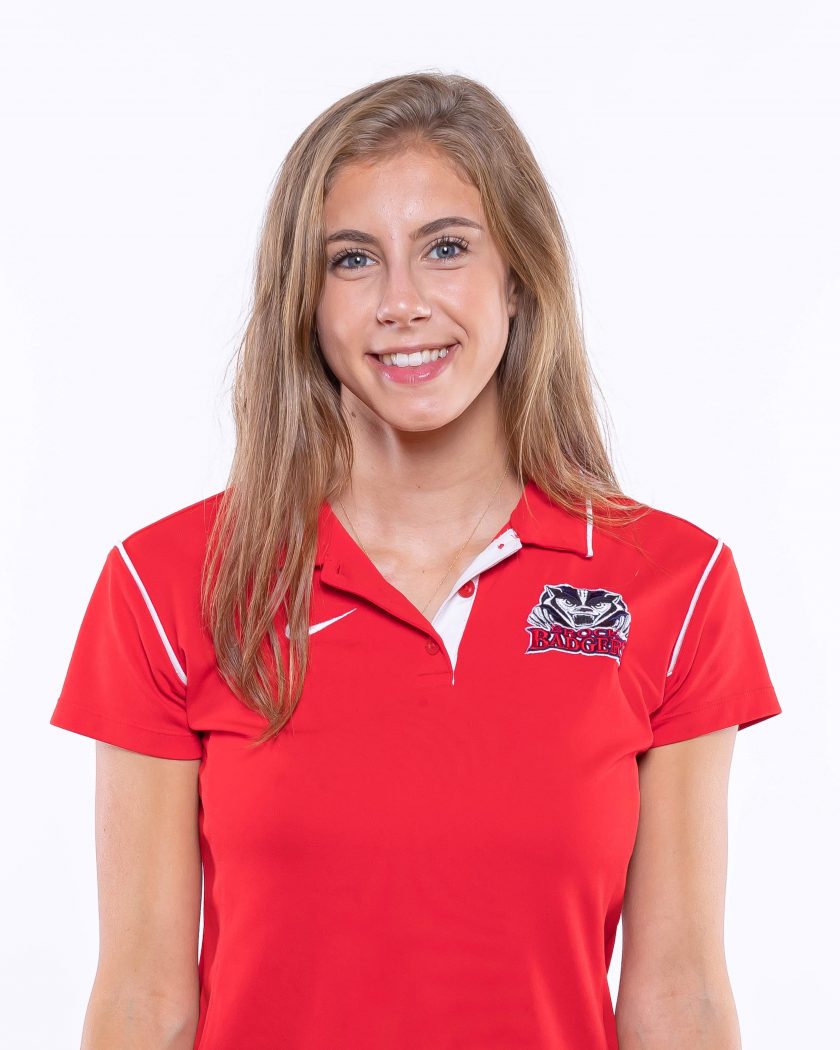
    A portrait of Haley Lang against white background.

    Haley Lang was recently attracted to Brock’s minor in Geomatics because of her interest in the relationship between environmental restoration and geomatics.

    Geomatics involves geospatial technologies and the collection and study of data about the surface of Earth and other planets. The science and technology studied in geomatics relates to cartography, remote sensing and geographical information systems (GIS) and has a wide range of applications in the real world, according to Associate Professor Kevin Turner in the Department of Geography and Tourism Studies.

    “Innovative use of geospatial data enhances our ability to make more informed decisions across many fields, including natural resource management, ecology and conservation, Earth and atmospheric science, hazard and emergency response, urban planning, transportation, business and policy development,” he says. “Geomatics is useful for students across many departments and programs who are interested in incorporating spatial context and practical analytical tools into their skill sets.”

    Turner says graduates equipped with skills in geomatics are sought after by employers in government and private sectors and within academic research programs.

    “This is demonstrated by the effort the CHS is placing into their recruitment campaign, which we look forward to learning more about next week,” he says.

    Brock students in any program can minor in Geomatics through the Department of Geography and Tourism Studies or integrate courses in geomatics with their major to develop skills for future employment.

    Geography and Tourism Studies major Haley Lang says she is declaring a minor in Geomatics because she has long been taken by the old adage about a tree falling in the woods and making a sound — in other words, how the world changes whether or not it is being observed.

    “We can really only see what is happening in front of us, but with geomatics, we can understand landforms, surfaces and the Earth as a whole on a greater scale,” she says. “I am fascinated with how the broad discipline of geomatics helps to bridge gaps within research and provide a greater understanding of the world we’re in.”

    All students are welcome to attend the CHS information session, which takes place Wednesday, Jan. 18 at 9 a.m. in MCC-405 of the Mackenzie Chown Complex, but they are asked to RSVP via ExperienceBU in advance.

    REPOSTED FROM THE BROCK NEWS

    Tags: , , , , , , , , , ,
    Categories: News

  • Brock geographer makes global connections during Fulbright Canada residency

    Almost two years after his Fulbright Canada Research Chair in Arctic Studies at the University of Washington was first announced, Kevin Turner is winding down his duties.

    The award normally involves a six-month residency, but the global pandemic prevented the Associate Professor in Brock University’s Departments of Geography and Tourism Studies and Earth Sciences from travelling to Seattle as expected.

    Instead, he virtually taught a fourth-year course in Arctic Landscape Change and Detection, conducted workshops for teachers and engaged in events hosted by the World Affairs Council, including a fireside chat with Chief Tizya-Tramm of the Vuntut Gwitchin Government through winter 2021.

    Earlier this spring, he was finally able to load his truck with his bikes and some field equipment and head west for his required in-person residency at the University of Washington.

    In spite of a hectic three-month schedule, Turner says the trip has created opportunities to meet up and collaborate with colleagues, sometimes in unexpected ways.

    In May, he travelled to Fairbanks, Alaska, for a meeting of NASA’s Arctic Boreal Vulnerability Experiment (ABoVE) Science Team. As a research affiliate of that program, he advises on airborne data acquisition and suggests key flyover locations from his main research site in Old Crow.

    “Being an affiliate of NASA ABoVE, I can help guide where they fly in northern Yukon and then utilize the data they collect within my research program, as can many others,” says Turner. “We also learn the latest on some of the cool things that colleagues are doing with the data to assess landscape conditions across the north, as well as share our own findings.”

    He attended a meeting of the International Circumpolar Remote Sensing Symposium in Fairbanks, which attracted top scholars from around the world, and was also involved in fieldwork being done by colleagues from University of Alaska, Fairbanks and the NASA Jet Propulsion Lab.

    “I was able to use some equipment I brought with me because I didn’t want it sitting in the truck at the airport while I travelled,” Turner says. “When I took it out for a little bit of show and tell, they invited me to visit one of their research sites to try it out.”

    Upon his return to Seattle, the University of Washington hosted Turner, Tram Nguyen, the 2021-22 Fulbright Canada Chair in Arctic Studies, and others for a roundtable discussion in late May on “Holistic Approaches to Health and Wellbeing in Arctic Communities and Beyond.”

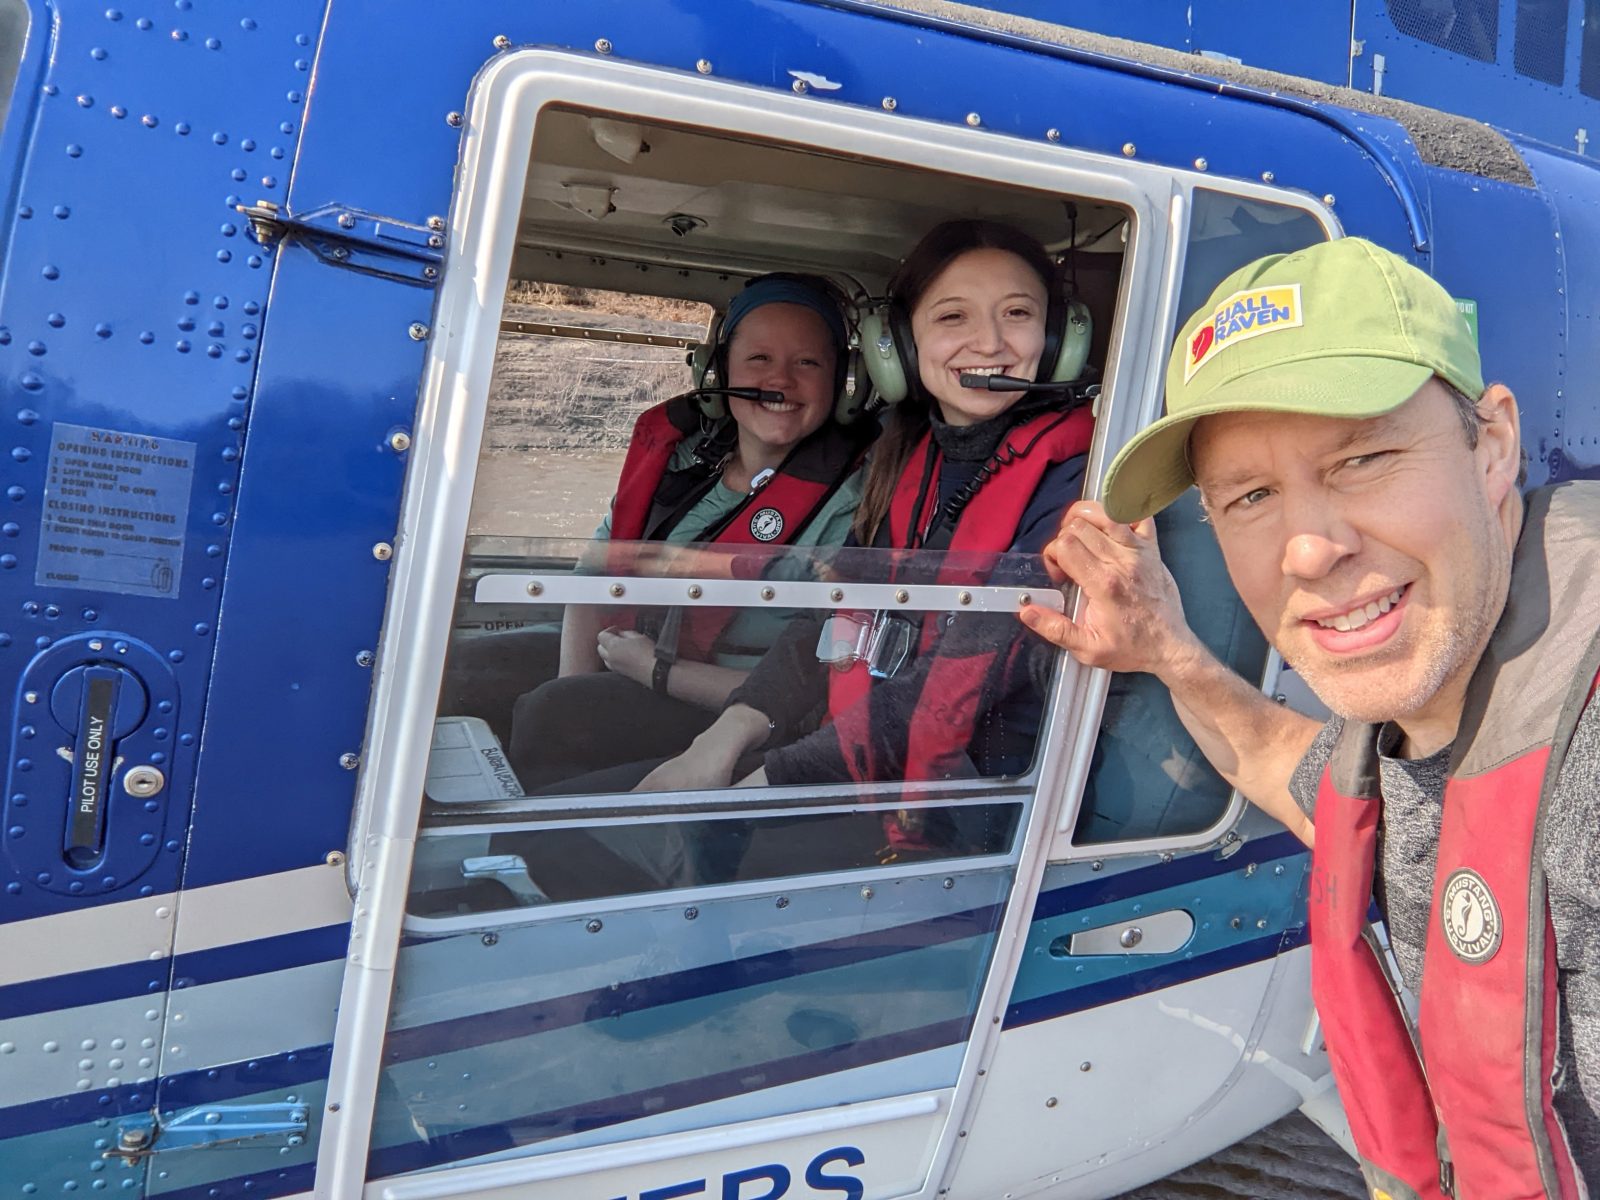
    In June, Turner flew north again for fieldwork in Old Crow, Yukon. The strict parameters of his VISA required him to travel on specific dates — which can be hard to commit to when research excursions are delayed by Arctic weather.

    Turner counted on Brock Earth Sciences graduate student Michelle Pearce (BSc ’20) and undergraduate student Marley Tessier to help him meet the logistical challenges of the research trip and collaborated with colleagues from Polar Knowledge Canada and Parks Canada, along with local Indigenous community members, including photographer and drone pilot, Caleb Charlie, to collect data. Turner also credits helicopter pilot Ruth Hardy with being able to work wonders in small time frames.

    In addition to gathering water samples and aerial survey photography, Turner also used a LiDAR sensor — “a Ghostbuster-looking sensor that shoots out 300,000 pulses of light per second” — to collect data for fine-grained 3D imaging of the landscape.

    His use of the LiDAR device was of particular interest to a documentary film crew from France and Germany working on a four-part series on climate change, who accompanied the researchers and interviewed Turner in the midst of the data collection.

    Turner has now returned to Seattle for the rest of July to crunch some data and collaborate with colleagues at the University of Washington.

    Though it hasn’t been without its challenges, he says that he has enjoyed the “shake-up” of the Seattle residency and the Fulbright Chair overall. And he looks forward to soon welcoming his family for a quick holiday in a nearby mountain cabin.

    “If I didn’t have the support of my family, this would be impossible,” he says. “My wife, Jen, is amazing, and my two boys have really stepped up to fill in the gaps of getting things done around the house in my absence. Their ability to carry on with me somewhere else for an extended period has made this smooth, but I really miss them.”

    Tags: , , , , , , , , , , , ,
    Categories: News

  • Brock to celebrate GIS Days with week of online events

    Brock will join institutions from around the world in celebrating Geographic Information Systems (GIS) Days by participating in a free weeklong virtual conference that is packed with events open to the University community.

    GIS Days 2021 features more than 50 online presentations, tutorials and demonstrations taking place Monday, Nov. 15 to Friday, Nov. 19 from 9:30 a.m. to 4:30 p.m. each day.

    Several representatives from the Brock community — an alumna, a master’s student, a lecturer and a librarian — will each be presenting a seven-minute ‘lightning talk’ on projects they’ve worked on using GIS tools such as geovisualization, geospatial technologies and story mapping.

    Isaac Williams, GIS and Data Services Librarian with the Brock University Library, who will present Story Mapping Queer Dallas on Monday at 9:30 a.m, said the breadth of disciplines that can use GIS is part of what makes the technology so compelling.

    “I think a lot of people associate GIS with geology or earth sciences, but you can use it in any field that involves something you want to locate,” they said. “There is a lot of interesting work being done across disciplines. I have done some work with GIS in humanities contexts, for example, mapping existing geographies, but also historical geographies such as the ones found in ancient Roman literature.”

    Sharon Janzen, Brock’s Map Library Associate and Geospatial Data Co-ordinator, will be leading a one-hour tutorial Friday at 2 p.m. that introduces participants to ArcGIS Online, a web-based mapping software.

    She says GIS Days is an opportunity to experience the variety of GIS usage across educational institutions and the public sector, and encourages the Brock community to register for some of the free events.

    “Whether an attendee comes with little knowledge of GIS or they have been using GIS their whole career, the conference will be sure to not disappoint,” she said. “From the geography of Pokémon Go and the movement of muskox, to Esri technology and Open Source QGIS, sign up for what’s sure to be the GIS highlight of the year.”

    Registration is required to access events; however, there is no registration deadline. Registration can take place minutes before a presentation begins.

    Learn more about GIS Days events, including this year’s schedule, by visiting the event web page. The interactive program can be used to search by presenter, presentation title or location.

    Brock University GIS Days events

    Story Mapping Queer Dallas
    Monday, Nov. 15 at 9:30 a.m. — Seven-minute lightning talk
    Presented by Isaac Williams, GIS and Data Services Librarian, Brock University Library

    Queer Dallas StoryMap is a project highlighting queer history in Dallas, Texas. The American South is home to a rich history of past and present queer life, organizing, survival and joy. The project’s goal was to make this history more visible to Southerners and people who live elsewhere. The presentation will discuss resources used in the creation of the project, decisions made in the visualization process and ways the project was shared.

    Researching Military Service using Geovisualization in Eleventh to Twelfth Century Normandy
    Wednesday, Nov. 17 at 11 a.m. — Seven-minute lightning talk
    Presented by Christopher Hewitt, Lecturer, Geography and Tourism Studies, Brock University

    In the 11th and 12th centuries, the Duchy of Normandy was an important source for military adventurers. While much has been written about soldiers who fought on these campaigns, little has been written about where they originated. This study demonstrates the value of geographic-based analysis through the use of historical geographic information systems (HGIS) techniques, including mapping locations as well as performing nearest neighbour analysis and kernel density mapping. The presentation will conclude with a discussion of the implications of these findings and the options for and benefits of applying HGIS analysis to other historical events.

    Using GIS to Re-imagine Historical Niagara
    Wednesday, Nov. 17 at 11 a.m. — Seven-minute lightning talk
    Presented by Brock alumna Jessica Linzel (BA ’18, MA ’20), Historical Researcher

    Linzel will explain how she incorporated historical GIS into her History master’s thesis. She used ArcGIS Pro to create a web map, which she then used to investigate Niagara’s economic development in the post-Revolutionary ‘Loyalist’ era. By mapping historical data from account books and ledgers and analyzing it alongside geographical features in the Niagara region, GIS technologies allowed her to bring a fresh perspective to a familiar topic.

    Using Geospatial Technologies: A Case Study of the Town of Lincoln, Ontario
    Wednesday, Nov. 17 at 2 p.m. — Seven-minute lightning talk
    Presented by Baharak Razaghirad, Brock University Master of Sustainability student

    Urban trees provide important benefits to communities, especially in the context of climate change. This presentation will discuss using geospacial technologies to assess urban tree canopies as a timely and accurate alternative to costly, ground-based assessments.  Razaghirad will discuss two approaches used to quantify the urban tree canopy for the Town of Lincoln —  remote sensing and a random sampling method.

    Introduction to ArcGIS Online
    Friday, Nov. 19 at 2 p.m. — One-hour tutorial
    Presented by Sharon Janzen, Map Library Associate and Geospatial Data Co-ordinator, Brock University

    During this hands-on experience, participants will explore ArcGIS Online, a popular web-based dynamic mapping software that is accessible on Windows and Mac platforms. No experience is necessary for this introductory tutorial, but curiosity is an asset. A valid login for the website is required (public or organizational accounts welcome). Visit the ArcGIS website to sign up for a public account.

    STORY FROM THE BROCK NEWS

    Tags: , , , , , ,
    Categories: News

  • Event to shine light on innovative GIS uses

    Whether you realize it or not, geographic information systems (GIS) are part of your everyday life.

    When you plan a trip in Google Maps, you’re using GIS. When news outlets use maps to add visuals to stories, they are made through GIS.

    But the software’s value doesn’t end there.

    GIS is used for spatial analysis, city planning, viticulture research, environment research and sport analysis. Last year’s Esri Canada Scholarship winner from Brock, Kyle Rankin, used GIS to analyze hockey, investigating shots on goal to determine the best place to shoot from in hopes of scoring.

    In an effort to help inform the Brock community of the innovative uses of GIS, the University’s Map, Data and GIS Library is hosting an event on Thursday, March 7.

    Esri Canada, from whom Brock licenses its GIS software, will be at the map library (MCC 306) from 10 to 11:30 a.m. to detail various GIS uses and to answer questions from the University community.

    Esri representatives will discuss both the researcher side of the software for students and faculty, looking at how GIS can support their work, and the administrative side, looking at how GIS can be used for areas such as recruitment and facilities management.

    Register for the event on ExperienceBU.

    Story reposted from The Brock News.

    Tags: , , , ,
    Categories: News

  • Mapping Wins and Losses on the Rink: A GIS Approach to Ice Hockey Analytics

    Story from the Esri Canada Blog, November 1, 2018

    Contributed by Kyle Rankin (Brock GEOG ’18), Associate GIS Analyst, Esri Canada

    Like many Canadians, I like to watch Hockey Night in Canada every week, which is where I got the idea of applying GIS to analyze hockey. In the months that followed, not only did I apply spatial analysis to hockey games, but I also submitted this analysis to apply for the Esri Canada Higher Education GIS Scholarship at Brock University.  Find out what made this a winning project.

    November 14 is GIS Day, celebrated by geographers, cartographers and GIS users everywhere. At Brock University, GIS students celebrate with a project competition sponsored by Esri Canada. The winner receives an Esri Canada Higher Education GIS Scholarship, which includes funding, software, training and networking opportunities to help students continue to develop their GIS skills and interests. I decided to work on a project applying GIS analysis to hockey games and submit it for the competition.

    As Canadians, we all know what hockey means to us: passion, athleticism, power and toughness––a hockey player is as Canadian as the maple syrup. For many people, myself included, the game of hockey doesn’t mean advanced regression models and mathematical formulas. However, this changed for me when I realized there was an opportunity to apply the power of GIS and Esri’s spatial analysis tools to analyze hockey.

    Every hockey team wants to understand how they can score more goals than their opponent and win more hockey games. If you are a hockey player, you’d more than likely agree this has as much to do with location on the ice during a game as an individual player’s talent. As a young hockey player, I was constantly taught where to skate to, where to shoot from and where to defend from. That’s applying the science of where to hockey!

    Locational understanding on the hockey rink is clearly evident. So, I formulated the basic question for applying spatial analysis to player and team performance: what datasets are needed and can be analyzed to help hockey teams increase their goal-scoring and ultimately improve their chances of winning a match?

    To expand on this, three questions came to mind:
    a) What kind of data would be easiest to collect and yield the best quality result? (Shot locations, player locations, puck location, etc.)
    b) How could I define areas on the ice that are associated with higher likelihoods of scoring?
    c) How can the fast and fluid game of hockey be analyzed using hard-defined areas?

    Armed with these questions, I approached the Brampton Beast professional hockey team’s manager of hockey operations, who showed great interest in my project and agreed to collaborate with me. Together, we set out to study the location where shots were taken on the ice to conduct statistical analysis. The report I created were not only easy to read and understand, but also provided meaningful insight into the team’s games.

    Data-Driven, Evidence-Based Reports

    Using data collected from the East Coast Hockey League (ECHL) online game centre , I digitized 705 points representing the location of shots for and against Brampton during 10 of their games. I relied on ArcGIS ModelBuilder to create a repeatable workflow for querying and analyzing the data. This allowed for reports to be created with ease, as the model pulled data that matched certain criteria and then performed analyses, such as kernel density, to highlight hot spots in shot-activity on the ice. I created several reports that were based on individual player performance, single games, certain opposing goalies and comparison charts of games won versus games lost.

    The team’s staff used these reports to gain a better understanding of the strengths and weaknesses of their strategy and to adjust their game-day strategy accordingly. Such reports can enhance coaching practices with data-driven and evidence-based strategies. Especially knowing how fast-moving and fluid hockey is––for example, while nobody can tell Sidney Crosby the exact coordinates of where he should shoot from, if you give him a map showing that he scores more often from the middle section of the ice than anywhere else, then he’ll be out there in the next shift doing just that. Using these reports to interact with players can help them better understand their statistics and the analysis of their play––looking at a cool map is a lot easier to understand than numbers on a spreadsheet.

    The home plate is right at the centre of the ice in the attacking zone, where most goals and high-quality scoring opportunities occur. Shots from the home plate are more likely to result in goals, which implies that if teams focus on shooting from here, they are more likely to win. The Beast’s staff identified this as a significant revelation––they decided to concentrate on making offense from the home plate, while also channelling their defensive strategies on preventing opponent shots within this area inside the blue line.

    Continue reading Kyle’s post on the Esri Canada Blog.

    Tags: , , , ,
    Categories: News