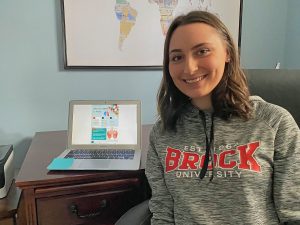
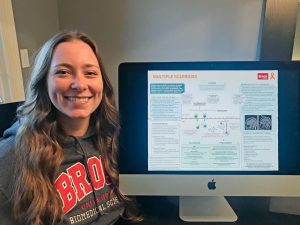
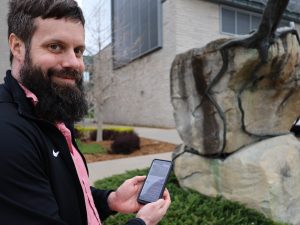
 Jaz Randhawa, a fourth-year Health Sciences student, is using an infographics class assignment to educate members of the South Asian community about atherosclerotic coronary artery disease.
 Jaz Randhawa adored her uncle, Gurjinder Kajla. When he died suddenly at the age of 44, Randhawa and her family were devastated.
Kajla died of atherosclerotic coronary artery disease, an illness that narrowed his arteries and eventually caused a fatal blood clot. His death left the family with an abundance of questions, wondering why there were no symptoms and how it could have been prevented.
In search of answers, Randhawa delved into her studies at Brock University to better understand atherosclerotic coronary artery disease, with the goal of educating others in the South Asian community.
She registered in HLSC 4P95, a fourth-year Health Sciences course taught by Assistant Professor of Health Sciences Rebecca MacPherson, while also taking a directed reading course with Health Sciences Professor Deborah O’Leary at the Brock-Niagara Centre for Health and Well-Being, which had her developing a website and posters explaining atherosclerosis.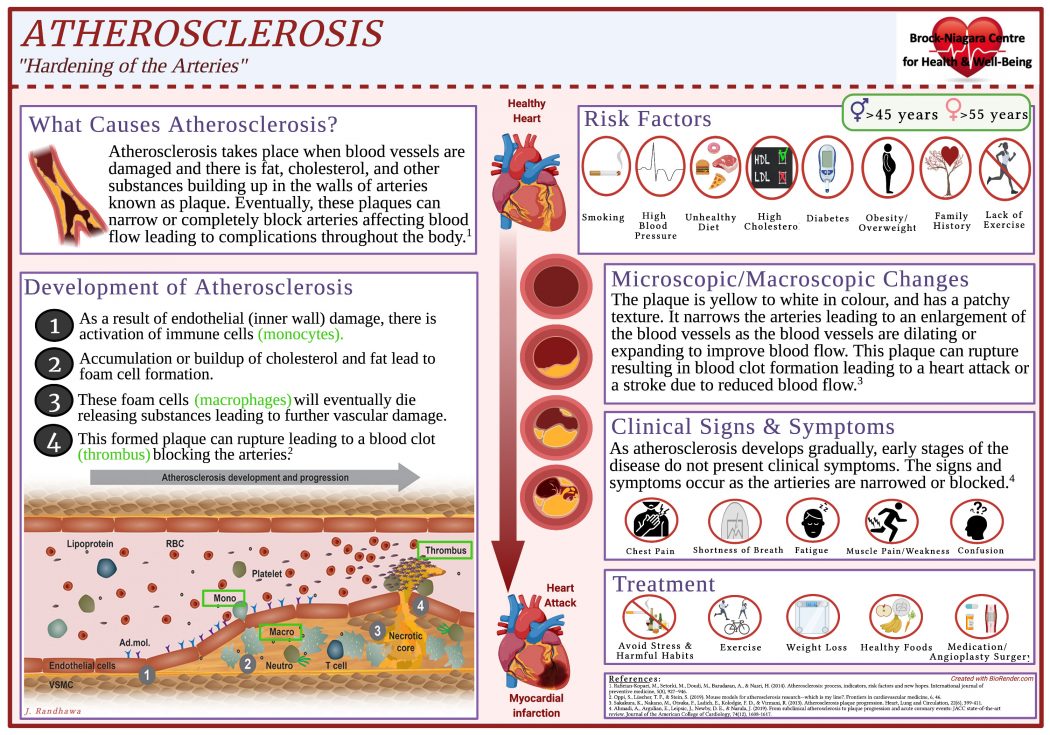
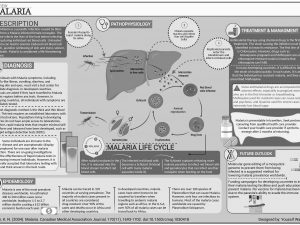
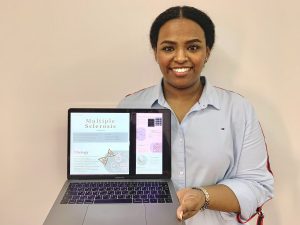
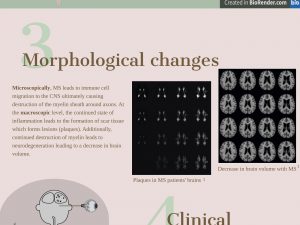
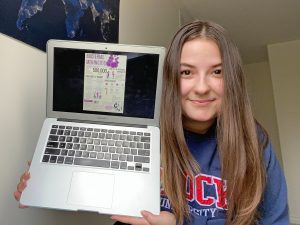
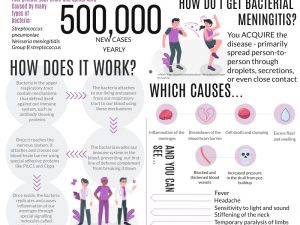
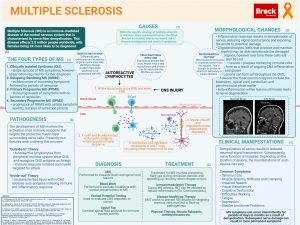
MacPherson gave Randhawa and her fellow students a bold, new assignment, asking them to create an infographic — a collection of imagery, charts and text that gives an easy-to-understand overview of a topic — on the disease of their choice.
“When I learned about infographics in that course, it just clicked,” says Randhawa. “This was an amazing tool that I could put on the website I was developing and also share with South Asian community organizations to get the word out there.”
This was exactly the intention of the assignment, explains MacPherson.
“The purpose of the infographic is for students to be able to translate their knowledge to a general population using terminology and figures that are understandable to others, so if someone were to see this, they would know what’s going on with the disease,” she says.
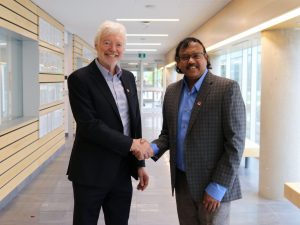
Wet-Laboratory Co-ordinator Parthajit Mukherjee, who works closely with MacPherson and her students, says that, in pre-pandemic times, HLSC 4P95 was a very “hands-on” experience in which students prepared and viewed pathological specimens under microscopes.
With pandemic restrictions, most in-person classes were cancelled, posing a dilemma for professors and instructors.
“We weren’t sure how students would adapt to online learning,” Mukherjee says. “There’s the constant challenge of giving students content and keeping them engaged.”
While brainstorming how to adapt the class to an online, pandemic world, and how to evaluate students’ learning, MacPherson and Mukherjee came up with the idea of having students create infographics.
The duo didn’t know what to expect, but the results did not disappoint.
“The infographics were awesome. They were really good and took information to the next level,” says MacPherson.
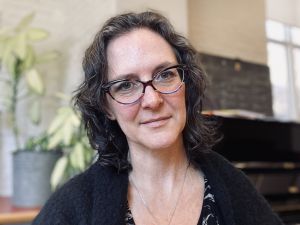
“A book is useless sitting on a shelf, so are all research findings and breakthroughs, if not translated and shared widely,” says Meriem Imam, one of the students who submitted an infographic.
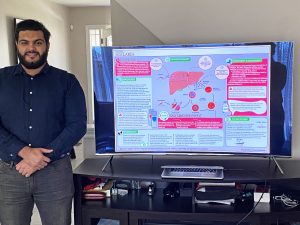
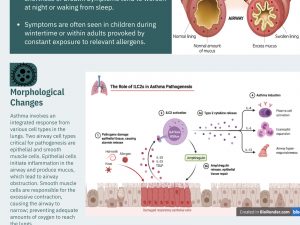
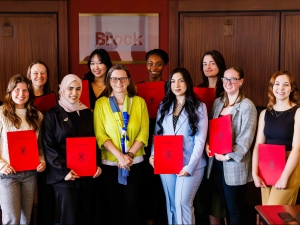
Teaching assistants recommended students’ infographics they thought were particularly effective, with MacPherson and Mukherjee selecting several to showcase as good examples from the 147 infographics created in the course. (See photo gallery below).
Infographics are an example of an effective and tangible knowledge mobilization strategy. The Social Sciences and Humanities Research Council of Canada (SSHRC) defines knowledge mobilization as being “an umbrella term encompassing a wide range of activities relating to the production and use of research results, including knowledge synthesis, dissemination, transfer, exchange and co-creation or co-production by researchers and knowledge users.”
The Ontario Neurotrauma Foundation notes that knowledge mobilization focuses on “getting the right information to the right people in the right format at the right time so as to influence decision-making.” Practitioners say infographics are typically more accessible and universally understood than scientific articles or reports.
SSHRC and other agencies that award research grants are increasingly requiring researchers to develop knowledge mobilization plans as a condition of funding.
“It’s a skill that our students should value and learn,” says MacPherson. “They’ve been working so hard towards building their knowledge but being able to explain that knowledge to somebody is very important.”
For her part, Randhawa plans to translate her infographic into Punjabi and Hindi, with the help of her mother, aunt and a family friend who is a doctor in India.
She will distribute her education materials through the Brock-Niagara Centre for Health and Well-Being, community groups and places of worship.
“We need to educate, empower and engage the South Asian community in their cardiovascular health,” says Randhawa, noting that this group, in particular, has a high prevalence of risk factors for atherosclerosis.
“The reason why I do this is so what happened to us doesn’t happen to other families.”
