
UAP progress update — year 1 (2025-26)
The University Action Plan (UAP), is the document that distills the institutional Strategic Plan — Transforming people, reimagining the future 2025–2030 — into University-wide indicators of success. Each indicator represents a measure of performance and/or success over time to achieve a specific objective. These indicators provide targets to enable the University to gauge progress and move forward on the University’s strategic priorities.
Progress reporting on the University Action Plan occurs every fall, as part of the University’s Annual Reporting cycle. Below is the Year 1 dashboard reporting the 2025–26 actuals relative to 2029–30 targets. All targets will be reviewed in year 2.
Strategic directions & priorities




University-wide indicators of success
Legend and colour code
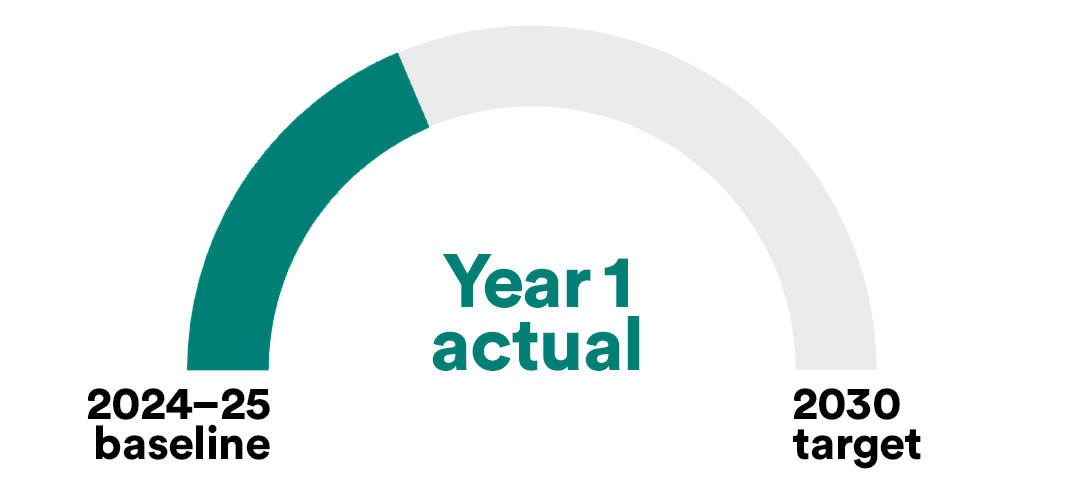
How to read progress charts and indicators: Year 1 progression to the 2030 target starting at the 2024–25 baseline, with colour filling in to show progress towards the 2030 target. Current year: Year 1 of 5.
Name of indicator
Green: progressing to target
Yellow: monitoring progression
Red: progression concern
Academic revitalization
Program and curricular degree architecture that facilitates the development of accessible, flexible, customizable and market relevant program offerings. This indicator measures curricular configuration.



Number of first-choice
applicants
Number of undergraduate programs with
the highest volume of first-choice applicants
Number of first-, second-, third- choice applicants
as a proportion of all applications
First choice
Second choice
Third choice
Percentage of graduates that complete their program
on time (or in less time) in relation to program length
Undergraduate
Master’s
PhD
Strategic enrolment
Optimal enrolment mix; undergraduate and graduate enrolments (domestic and international);
student retention; student progression to graduation.
Total number
of students
Number of
undergraduate students
Number of
graduate students
Future-ready learners
Educational experiences that provide students the learning outcomes that enable them to be academically prepared, digitally fluent and career ready. This indicator measures learner competencies.
Graduate employment rate
in a related field*;
2 years out
Graduation
rate*
.
Number of non-credit
Professional and Continuing Studies
learners
Research scholarship and creative activity
Increased research activity from inception to mobilization, fostering our pursuit of a better tomorrow.
Total research
revenue
(3-year rolling aggregate)
Research revenue
from private sources*
(3-year rolling aggregate)
University advancement
Total revenue from philanthropic contributions to the University and activities that engage and develop relationships with prospects, donors and other partners for funding opportunities.
Total impact of philanthropy
in a fiscal year
Alumni Engagement
Index
Dynamic and inclusive culture
How students, faculty and staff experience the campus environment, including their perceptions of engagement, equity, decolonization and inclusion, which is created and influenced by the efforts and resources invested, and by interactions both with the University and amongst the diverse members of the Brock community.
Number of Indigenous learning sessions, events and programming offered, and number of attendees
Occasions
Attendees
Number of EDI** learning sessions, events and programming offered, and number of attendees
Occasions
Attendees
Student
engagement
survey results
Employee
engagement
survey results
N/A
launch in 2026/27
Equity Census response rates
Students
Employees
Financial health
Balanced budget with optimal resource allocations to meet the diverse demands of the University.
Viability
ratio
Morningstar
DBRS rating
Baseline: A (high) with stable trend
Year 1 actual: A (high) with negative trend
Target: A (high) or better
Funding budget
(deficit)
Sustainability
Advancing sustainability across all dimensions —academic, research and operational — by aligning with the social, environmental and economic pillars of sustainable development.
Annual performance in
third-party Sustainability
rankings of higher
education (STARS***)
Baseline: STARS Silver
Year 1 actual: STARS Silver
Target: STARS Gold
Times Higher Education
sustainability
impact rankings
scope 1
carbon
emissions
Number of
sustainability
related courses
Reputational strength
The perception and standing of Brock University in the minds of key audience groups.
Quacquarelli Symonds (QS)
World University
Subject Matter Ranking
(Sports-related subjects)
QS World University
Subject Matter Ranking
(5-year aggregate academic nomination count)
Favourability rating
as part of awareness and
perception survey
N/A
launch in 2026/27
Community impact and global reach
Advancing partnerships across both our local and global communities that foster the reciprocal exchange of knowledge, resources and experiences driving meaningful impact and mutually beneficial partnerships.
Community Memorandum
of understanding (MOU)
Partnerships
Number of
Brock students
studying abroad
Number of
international academic
pathway partnerships
Economic
impact
Number of contactable
internationally located alumni
Additional indicator information
Learn more about indicator definitions, data source, count date and progression towards 2030 target.
* Denotes an SMA4 metric.
** Equity, Diversity and Inclusion.
*** Sustainability Tracking, Assessment and Rating System.