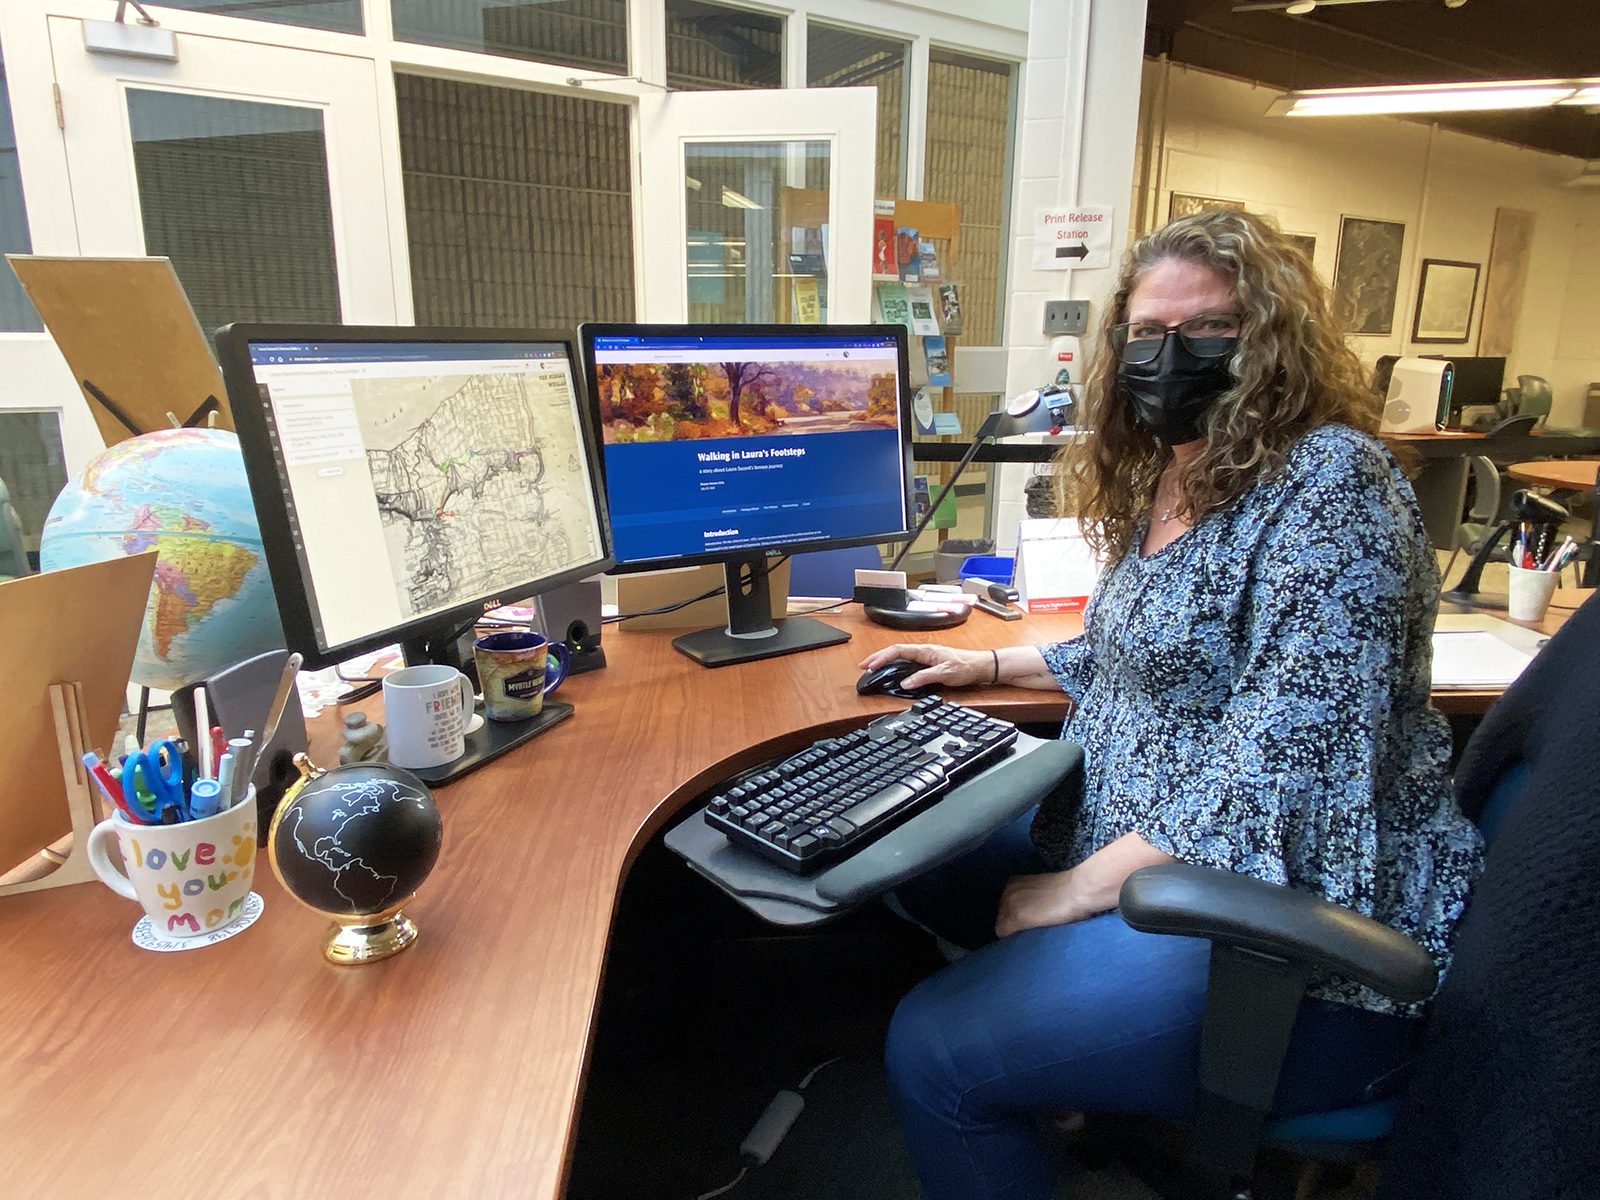
 Sharon Janzen, Map Library Associate and Geospatial Data Co-ordinator with the Brock University Library, shows a StoryMap created to illustrate Laura Secord’s historic walk from Queenston to Thorold.
If a picture says a thousand words, a story map can share a saga.
ArcGIS StoryMaps is a web-based platform available for free to the Brock community for showcasing narrative, images, video, audio, apps, interactive maps and other multimedia content.
Sharon Janzen, Map Library Associate and Geospatial Data Co-ordinator with the Brock University Library, encourages faculty and graduate students looking for unique ways to illustrate research, projects and reports to learn about ArcGIS StoryMaps via two upcoming webinars.
“Many organizations around the globe are using StoryMaps to create digital exhibits, compelling narratives and interactive mapping, such as National Geographic, The Smithsonian Institute, universities and non-profit organizations,” she says.
Janzen is leading two webinars this month on how to use the Ersi web-mapping and storytelling tools. On Thursday, June 9, Intro to ArcGIS Online will introduce participants to the tool’s interface and explore its new map viewer to create an interactive web map. On Thursday, June 16, Intro to StoryMaps will teach participants how to combine an interactive map created in ArcGIS Online with narrative text, images, video and/or audio clips to create an engaging and creative visual presentation. Both workshops will take place from 10 a.m. to noon via Microsoft Teams.
David Telfer, Professor with Brock’s Department of Geography and Tourism Studies, recently used ArcGIS StoryMaps in a third-year Geography of Water Resources class. Students were tasked with creating a lab assignment on StoryMaps to present their findings about a pressing water issue they researched, such as sea level rise, drought or water contamination.
“StoryMaps are an excellent way for students to further extend their written assignment by allowing students to incorporate multimedia such as images and videos, and create custom-made interactive maps,” says Telfer. “Sharon Janzen has been an excellent resource creating an ArcGIS StoryMaps tutorial for my classes and she always makes herself available to answer questions.”
Jessica Linzel (BA ’18, MA ’20), Director of Community Engagement for The Brown Homestead and past Esri Canada GIS Scholarship recipient, uses StoryMaps to present complex ideas about history in a more accessible way. Linzel is creating a series of web maps that outline the boundaries of The Brown Homestead and show how the land evolved from its Indigenous origins and then Loyalist settlements to several generations of Brown family and new owners who partitioned and sold or purchased land.
“The cultural landscape can be shown with GIS and historical maps, along with aerial photos that reveal patterns that one can’t visualize through documents found in a basic title search,” she said. “The result is a web map with lots of interesting layers, but no explanation. It’s like inviting someone to a historic site but not offering any tour guides, commemorative plaques or interpretive panels along the way. Story maps are an engaging and effective way of presenting digital maps, while also allowing the researcher to interpret their purpose and significance.”
To see how StoryMaps can showcase research and projects in an engaging and interactive way, browse the StoryMaps at Brock collection.
