Refined Question
How do insurance costs vary with age?
Data
The data for this research came from www.kanetix.com
which allowed me
to compare costs for different insurance companies. Once the questionnaire
was filled out, the only variable that I changed was age so that I
could get a
fair comparison without changing other variables.
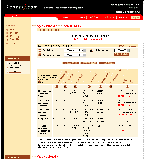
Here is the Sample Comparison Chart.


Analysis
The information from the web site came from a variety of Canadian
insurance companies. The rates that were generated were based on a
questionnaire. Since I wanted to isolate the age and gender variables
I completed the form once and changed only the age option to generate
the next chart.


Using the charts that were generated
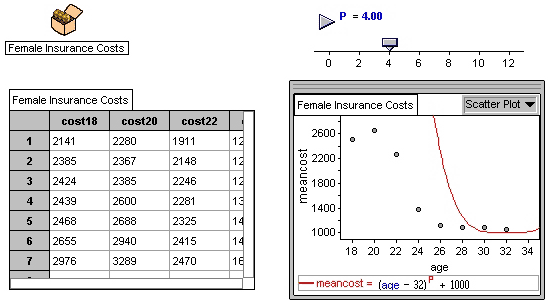
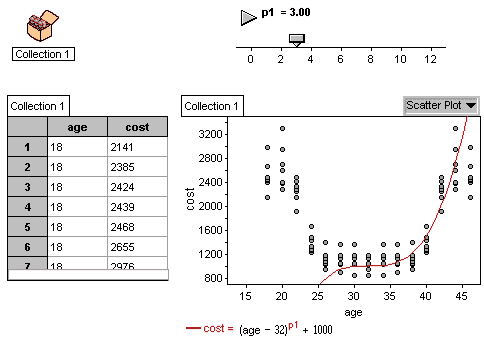
by Kanetix I entered the data into a collection chart on Fathom. Fathom
was also used to create a scatter plat to see the relationship between
the age of a person and the cost of insurance. There was a definite
curve in the plot so the correlation was non linear.

I used the mean of the costs of the different insurance companies
to create a
scatter plot but I found that it did not give the best representation
of the data so I
created a graph which showed all the points of every insurance company
at every
age group.


Due to the nature of the curve, at some exponents
the curve would not be
calculated to the left of the vertex. So I set the centre to be at
the last age group
that I generated a chart for and entered the information in the opposite
order
creating a reflection along the vertical line marked by the last actual
age group.

Conclusion
I found there was a non-linear regression similar
to an exponential regression.
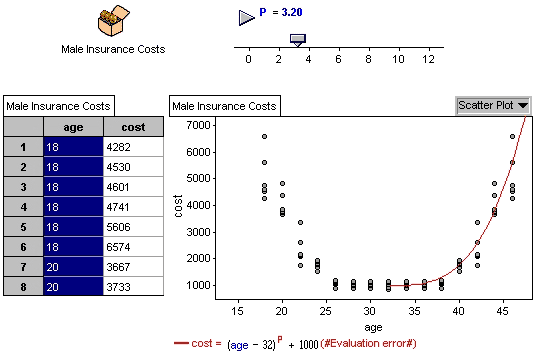
Using Fathom I was able to calculate the relationship between age
and
insurance costs using a formula that automatically displays the line
represented
by that formula. Although the lines of female and male costs look
very similar we
can see by the formula that the male costs fall quicker than the female
costs. At
age 26, the costs of insurance are relatively similar for males and
females given
that the other variables remain constant. The reason for the rapid
decrease in
males is because the insurance rate for males at age 18 (the beginning
of my
study) is more than twice as much as females so it has a larger amount
to drop
by age 26 when they are very similar.
It is clear that all the work that I completed deals
with non-linear relationships
between the variables that I had selected. Unfortunately this lies
outside the
scope of the course but between the Kanetix data and the newly found
MTO
data I was able to find two variables that appear to be linearly related.
>>NEXT