Area of Interest

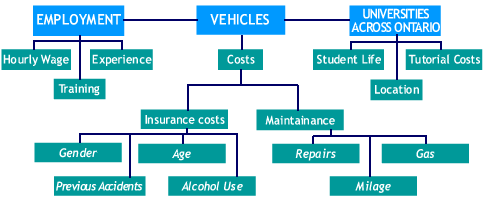
1. How many students attend university today compared
to 10 years ago, 20
years ago?
2. How does drinking correspond with insurance costs?
3. What factors are important to look for in a job?
This suggested the following chart.
I found that I had to limit my search for information
to something that was more
manageable and my search for data soon led me to concentrate on the
issue
of car insurance.


I started by looking for data to explore whether car insurance rates
were
affected by alcohol use. Although one company discounted the cost
for
abstaining from alcohol I did not notice any substantial difference
so I dropped
this avenue but for interest I sought out data on alcohol related
accidents and
found the internet source
http://www.nh-dwi.com/caip-206.htm
from the Community Alcohol Information Program (CAIP), a private,
non-profit
agency founded in 1977 to provide alcohol education, assessment, and
evaluation services to persons convicted of alcohol related offenses
in New
Hampshire. These statistics are complied by the U. S. Dept. of Transportation
and the N. H. Department of Safety. Since I found no data on Canada,
I did not
pursue it further. I did not follow up any further on the issue of
alcohol and
driving. I decided to search for data on car insurance costs and found
that
quotes could be obtained from
http://www.kanetix.com
which allowed me to compare costs for different insurance companies.
Once
the questionnaire was filled out, the only variable that I changed
was age so that
I could get a fair comparison without changing other variables. As
I suspect the
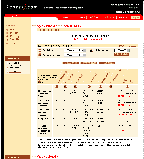
insurance costs varied with age and gender. A typical page from the
Kanetix
website looks like this


I decided to follow this up by looking for information
on Canadian age and gender
data from ESTAT available from Statistics Canada.
The data that was collected came from a variety of
web sites and from the
ESTAT database.
To obtain the results from estat follow the set of
directions below:
1. Go to http://estat.statcan.ca/
and choose ENGLISH.
2. Accept the terms of the preceding Licence Agreement.
3. From the Table of Contents choose Education, Data,
and Students.
4. Search for the following table numbers to locate the information
regarding
the possible research topics.
110-0002
110-0029
For example the following data was found on the distribution
of population by
sex and age


I also searched for data which would give me information
on accident rates and
age of the driver. I did find some data on the Fathom CD itself which
I obtained
as follows:
1. Choose Open from the File menu.
2. Open the Sample Documents folder, then the Learning Guide
Starters,
and then Accidents.


Although this was a start I did not have any information
on Ontario. It is only
much later into the project that I located data that I would have
liked to have had
from the beginning! This data was found in the Ontario Ministry of
Transport
web site
http://www.mto.gov.on.ca/english/
I did a search on "driver licenses by
age", from which I found a number of
Ontario Road Safety Reports
and I selected one of the more recent ones for the
year 2000 under
the heading "Ontario Road Safety Annual Report 2000 - PDF",
with web address
http://www.mto.gov.on.ca:80/english/safety/orsar/orsar00/ors_00.pdf
Of special interest was the following
data provided in this report


Reference:
p. 31, table 2.20, "Driver Age Groups -Number Licensed, Collision
Involvement and Percent
Involved in Collusions, 2000", Ontario Road Safty Report, 2000.
With these various sets of data I was ready to start
narrowing down my questions
and exploring what the data I had found could point to.
>>NEXT