Math Trail
SOLUTIONS:
Vancouver Information Math Problems
1) The province that contains the largest portion of the population is Ontario. Percentage = (11,410,046 / 30,007,094) * 100 = 38.02 %
2) British Columbia's population has increased by 183,238 people. This represents a percent increase of 4.9%.
Calculations: Difference in population = 3,907738 - 3,724,500 = 183,238 people. Percentage increase = (183,238 / 3,724,500) * 100 = 4.9 %3) Richmond represents 4.2 % of British Columbia's population.
Calculations: Percentage increase = (164,345 / 3,907,738) * 100 = 4.2%4) [Answers will vary depending on your location.]
5) So now we know that it is possible to cross each of the six bridges only once. This solution can be seen at the Math Forum Site.
But it is a good idea to think about WHY there is a solution to this problem and not the previous one. Once you feel comfortable with this you may want to return to thinking about the original problem.
|
|
Consider the explanation about Euler's proof from the Math Forum Page. Here is the answer as it appears on that site:
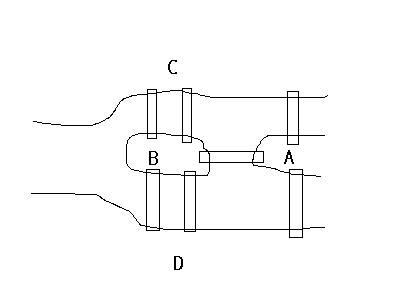
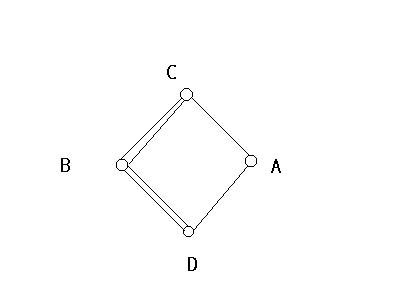
Euler realized that all problems of this form could be represented by replacing areas of land by points (he called them vertices), and the bridges to and from them by arcs. For Konigsberg, let us represent land with vertices (labelled A,B,C,D) and bridges with lines (or arcs) (see picture above).
The problem now becomes one of drawing this picture without retracing any line and without picking your pencil up off the paper. Consider this: all four of the vertices in the above picture have an odd number of arcs connected to them. Take one of these vertices, say one of the ones with three arcs connected to it. Say you're going along, trying to trace the above figure out without picking up your pencil. The first time you get to this vertex, you can leave by another arc. But the next time you arrive, you can't. So you'd better be through drawing the figure when you get there! Alternatively, you could start at that vertex, and then arrive and leave later. But then you can't come back. Thus every vertex with an odd number of arcs attached to it has to be either the beginning or the end of your pencil-path. So you can only have up to two 'odd' vertices! Thus it is impossible to draw the above picture in one pencil stroke without retracing.
6) There are 10 possible ways to get from Surrey to Vancouver (using different bridge/tunnel combinations) and assuming the fewest number of bridges possible (i.e. don't go back and forth across another bridge just to make a different combination).
Possible Ways:
7) [Answers may vary.]
8)
The percentage of the total population that this represents = 16% x 28% =
4.5%
9)
[Answers may vary.] Possible answers may discuss fear of being in
traffic, lack of physical fitness required for the task and also the
inconvenience of doing physical activity as a way of getting to a work place
that has a dress code, etc.
In terms
of not feeling safe, 53%
of drivers, 39 % of recreational cyclists, and 34 % of non-recreational
cyclists believe that cycling is not safe.
| Percentage of Victims of Accidents | ||
| Type of Commuter | Calculation | % |
| Cyclists | 1007 ¸ 27314 * 100 | 3.7% |
| Pedestrian | 1723 ¸ 27314 * 100 | 6.3% |
| In Vehicle | 23620¸ 27314 * 100 | 86% |
It appears by these calculations that driving is the most hazardous but remember that this percentage also accounts for the fact that people in vehicles represent such a large portion of the total number of commuters.
| Percentage of Fatalities | ||
| Type of Commuter | Calculation | % |
| Cyclists | 1007 ¸ 27314 * 100 | 3.7% |
| Pedestrian | 1723 ¸ 27314 * 100 | 6.3% |
| Vehicle Passenger | 23620¸ 27314 * 100 | 86% |
| Motorcyclists | ||
[Answers may vary regarding the most dangerous form of transportation.]
In terms of the statistics it shows being a passenger in a vehicle is the most dangerous but again the important thing to note is the huge percentage that vehicle passengers represent of the total number of people commuting. The important fact missing from these statistics is how they relate and how many people died per actual accident.