Math Trail
SOLUTIONS:
1)
Average number of trips per person = 5.5
¸
2 = 2.75 trips per person
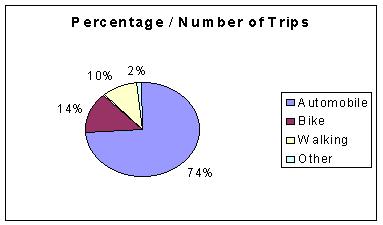
| Type of Transport | Trips per Transportation Mode |
| Automobile | Automobile Trips: 5.5 x 74% = 4.07 million trips |
| Bike | Bike Trips: 5.5 x 14% = 0.77 million trips |
| Walking | Walking Trips: 5.5 x 10.3 % = 0.57 million trips |
3) Circle Graph that represents this information:
4)
Monthly Average Cost = $220 ¸ 12 = $18.3 dollars
per month
5a) The concession fare is 63.5% of the regular adult fare. (Calculation: 40 ¸ 63 = 63.5%)
5b) [Answers will vary.]
6) The student ratio (75%) is bigger than the adult ratio (66.7%) by 8.3%
Calculation Ratio - 1 zone : 2 zone Adult - 2 : 3 (66.7%) Concession - 1.5 : 2 = 3 : 4 (75%)7) To make it financially worth it to get a transit pass:
An adult would have to make 32 trips to pay off a pass (Calculation: $63 ¸ $2 = 31.5)
A youth would need to make 27 trips to pay off a pass (Calculation: $40 ¸ $1.5 = 26.7)
8) Monthly savings by a student who buys a pass: Assuming 4 weeks of 5 school days gives us 20 days in a month. Each day the student would spend $3 on transit tickets, thus in a month the student would spend 20 x $3 = $60. Since the monthly pass is $40, the student would save $20.
| Annual Cost for 2002 Chevrolet Cavalier 4 Cylinder | ||||
| km / Year `` | Variable Costs | Fixed Costs | Total Costs | Cost / km |
| 12,000 km/year | $1,470.00``` | $6263.40 | ||
| 18,000 km/year | $2,205.00 | $6,263.40 | ||
| 32,000 km/year | $3,920.00 | $8,027.40 | ||
Computed Table for Questions 9 & 10
| Annual Cost for 2002 Chevrolet Cavalier 4 Cylinder | ||||
| km / Year `` | Variable Costs | Fixed Costs | Total Costs | Cost / km |
| 12,000 km/year | $1,470.00``` | $6263.40 | $ 7733.40 | 64¢ |
| 18,000 km/year | $2,205.00 | $6,263.40 | $ 8468.40 | 47¢ |
| 32,000 km/year | $3,920.00 | $8,027.40 | $11947.40 | 37¢ |
10)
The distance that gives you the cheapest
11) Percentage of total cost for each distance travelled:
For 12 000 km, the fixed cost is 81% if the total
For 18 000 km the fixed cost is 74 % of the total cost
For 32 000 km the fixed cost is 67% of the total cost
12) [Answers may vary.]
13) [Answers may vary.] Possible Solution:
| Type of Transport | Cost per year |
| Car - driving 2002 Chevy Cavalier 32,000 km/yr | $11947.40 (see chart above) |
| Bike | $220 (given in Q4) |
| Public Transport - adult who buys passes monthly | 12 * $63.00 = $756 |
The car owner spends ($11947.40 - $756 = $11,191.40) more than a person who rides transit
The car owner spends ($11947.40 - $220 = $11,727.40) more than a person who rides a bike
14a) The family spends $723 on automobile expenses.
Calculation: 19.5% of the total cost is $385. Then total budget = 385 ¸0.195 = $2026. Automobile costs are 35.7 % of the total, so automobile costs are $723.
14b) Their total monthly budget = $385 ¸0.195 = $2026
14c) The parents spend $39.30 on clothing.
Calculation: The total clothing costs are 9.7% of $2026 = $196.5. Of this, the parents spend 20%, which is $39.30 per month.
15a)
Minimum number of participants = 130 cars x 4
passengers = 520 passengers
15b) Maximum number of participants = 130 vans x 7 passengers = 910 passengers
15c) If there are equal numbers of cars and vans, then there would be 65 x 4 + 65 x 7 = 715 passengers total
16) There must be approximately 13 cars and 117 vans.
Calculation: Let x = number of cars. Then 130 – x = number of vans 870 = 4x – 7(130-x) 870 = 4x + 910 – 7x x = 13.3 Thus there must be approximately 13 cars and 117 vans.17)
[Answers may vary.] Possible Solution: The ride-share trips account for
approximately less than 1/10 of 1% of all automobile rides taken on any given
day.
18) [Answers may vary.]
19)
Given that all the lines between the years are straight,
we can calculate the average by simply estimating the value at each year, and
finding the average of these values (we do not need to calculate the area of
the pollution using more complex methods).
Thus, estimating the values off the graph, the average pollution for ozone from 1994 to 2000 is:
38 + 39 + 44 + 35 + 42 + 43 + 37 = 278¸7
= 39.7 % of the time
Similarly, for PM 10 the average pollution is:
7.5 + 6.3 + 3.8 + 6.5 + 2.8 +3.0 = 26.1 ¸ 6 = 4.4 % of the time
20) A likely reason for the sharp increase in 1998 was the huge number of forest fires that blazed throughout BC that summer.
21) Light duty vehicles account for 58% of 357 000 tonnes. Thus the answer is 207 060 tonnes.
22)
If
light duty vehicles only produced half of their emissions, that would be 103
530 tonnes. Then, total tonnage of emissions would be 357 000 – 103530
= 253 470 tonnes. The percentage
of emissions produced by light duty vehicles
is 103 530 ¸
253 470 = 40.85 %
A circle graph representing this new distribution of pollutants is as follows:
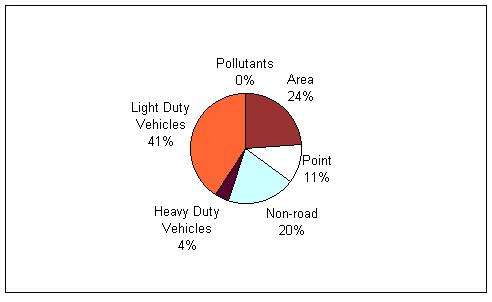
23) The CO emissions are 60 % of 357 000 tonnes, which is 214 200 tonnes. Light duty vehicles produce 94% of CO, which is 201 348 tonnes of CO.
24) The fact that there is an order of magnitude between the lower and upper limits in the number of deaths certainly points to ambiguity in the measuring of causes of death. However, given that the lower limit is a small integer (15), this type of variation is not surprising, and much less significant than if the limits were bigger (for example in the thousands and tens of thousands).