Math Trail
Vancouver
is a city in motion. With almost
2 million residents, there are 5.5 million trips taken within the city each
day!
1.
How many trips per person does that average to?
Of
these trips, 74% are done in automobiles, 14 % are done by people either
walking or biking, and 10.3% are done on public transit.
2.
How many trips are done by each mode of transportation?
3.
Can you draw a circle graph to represent these modes of
transportation?
If
you lived in Vancouver, which do you think would be the cheapest way to
travel – driving, walking, biking, or
taking the bus?
By
far the cheapest way to get around is of walking of course.
The only expenses might be buying another pair of shoes!
Biking
is similarly an inexpensive way to commute at approximately $220 per year.
4.
If the average cyclist spends $220 per year on repairs and
maintenance, how much is the monthly average cost? Solution
|
|
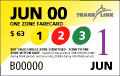
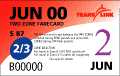
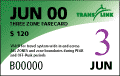
Taking public transit is a bit more expensive. |
|
The monthly pass prices in Vancouver are as follows:
|
5. Concession fares are given for students and seniors. a) What percentage of the adult fare is the concession fare for a 1 zone
pass? b) Should there be other people who should be given concessions? If so, why? |
Alternatively, you can purchase a ticket when you board transit, which is good for 90 minutes of travel in any direction.
|
Regular Fares |
Zones |
Adult |
Concession |
|
From
start of service to 6:30 p.m. |
1
Zone |
$2.00 |
$1.50 |
|
2
Zone |
$3.00 |
$2.00 |
|
|
3
Zone |
$4.00 |
$3.00 |
|
|
Discount Fares |
Zones |
Adult |
Concession |
|
Weekdays
after 6:30 pm and all day Sat., Sun., & holidays |
1,
2 or 3 Zones |
$2.00 |
$1.50 |
6.
Express the price of the 1 zone fare to the 2 zone fare as a ratio,
for both the adult and the concession prices.
Which ratio is bigger? How
much bigger? (That is,
what percentage?)
7. How many trips would you have to take in a month to make it worthwhile to get a transit pass? Solution
8.
If you went to and from school every day on the bus, how much money
would you save in a month by buying a transit pass?
While
being the most popular method of transportation, driving is yet the most
expensive way to commute. The
CAA estimates a car cost approximately $8,000/year to own and operate.
Consider an example annual cost:
| Annual Cost for 2002 Chevrolet Cavalier 4 Cylinder | ||||
| km / Year `` | Variable Costs | Fixed Costs | Total Costs | Cost / km |
| 12,000 km/year | $1,470.00``` | $6263.40 | ||
| 18,000 km/year | $2,205.00 | $6,263.40 | ||
| 32,000 km/year | $3,920.00 | $8,027.40 | ||
9.
Calculate the total costs for each row.
10.
Calculate the cost/km for each row.
Which distance gives you the cheapest cost per km?
11. What percentage of the total cost are the fixed costs for each distance traveled? Solution
12.
Why do you think the fixed costs are higher for the 32 000 km traveled?
13.
How much more money will a car owner spend on transportation in a year
than someone who takes transit? Than
a cyclist?
Automobiles
are actually one of the biggest expenses for most Canadians.
According to Statistics Canada, of every $100 of spent on retail
purchases, Canadians spent $35.70 on motor vehicles, parts and services,
$19.50 on food and non-alcoholic beverages, and $9.70 on clothing,
accessories and footwear. (1999
statistics)
14.
Jose and Maria’s family spend $385 per month on food.
a)
How much do they spend on automobile expenses?
b)
What is their total monthly budget?
c)
If Jose and Maria buy 80% of the clothing in the family, how much do
their parents spend on clothing?
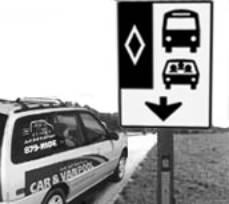
| Sharing
can always be beneficial, as is the case with cost sharing of driving. In
1992, seeing that traffic congestion and pollution were significant problems
for Vancouver, local philanthropist, Jack Bell, started a vanpool, carpool, ride share program.
Currently there are approximately 130 vehicles which take part in
ride-share.
Courtesy of: http://www.ride-share.com/jbfinfo.html |
|
15.
Given that on average cars have 4 passengers and vans have 7
passengers
a)
What is the minimum number of participants in the program?
b)
What is the maximum number of participants in the program?
c)
What would you estimate to be the actual number of participants in the
program?
In actual
fact approximately 870 people take part in the program.
16.
If
all cars have 4 passengers, and all vans have 7 passengers, how many vans and
cars are there?
17.
What percentage of the all the trips done in automobile (see above)
each day are done in a ride-share situation?
18.
Do you think this percentage is low, about right, or high?
What factors do you think stop more drivers from using ride share
programs?
When
we think of pollution, we usually think of smog. Smog
or SMOke and Gases
is the haze that results when air contaminants mix and react in the
atmosphere. A harmful by product of this process is ozone. Ground level ozone
· Particulate Matter (PM)
PM10
- inhalable particulate matter
PM 2.5 – fine particulate matter
· Nitrogen Oxides (NOx)
· Sulphur Oxides (SOx)
· Volatile Organic Compounds (VOC)
·
Carbon monoxide (CO)
Because of
geography, the pollution produced in Vancouver usually gets concentrated in
the Lower Fraser Valley, as the air mass hits the mountains and condenses.
Thus while Vancouver can be enjoying beautiful blue skies, residents
in the Fraser Valley can be surrounded by haze.
This haze or smog that often blankets the Lower Fraser Valley
makes air quality a continuing concern in the region.
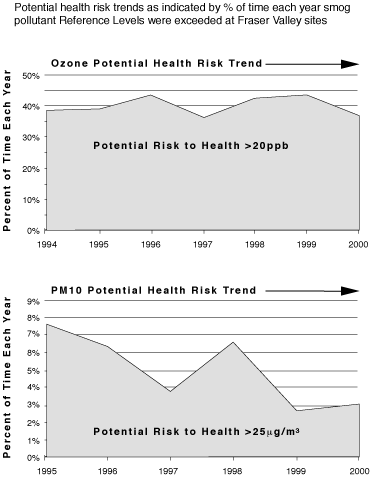
19. Calculate the average percent of time that there has been a health risk from ozone since 1994. From PM10 since 1995? Solution
20. What is the percent increase in risk from PM10 from 1997 to 1998? Why do you think this sharp increase might have occurred? Solution
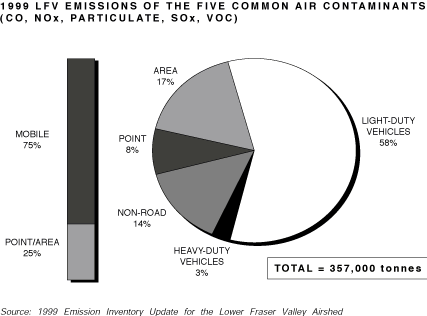
21.
How many tonnes of emissions do light-duty vehicles produce?
22.
If we reduced the pollution from light-duty vehicles by half, what
percentage of the total emissions would they produce?
Draw a circle graph to represent this situation.
Light duty
vehicles (such as cars and trucks) account for 94% of the CO emissions in the
Lower Fraser Valley (LFV). CO is the largest contaminant overall in
emissions, representing 60% of total emissions
23.
How
many tonnes of CO do light duty vehicles produce each year?
A report commissioned by the
Medical Health Officers of the Lower Mainland health regions concluded that
current levels of air pollution in the Lower Mainland have an effect on human
health. Although levels of air pollutants in the Lower Mainland are lower
than other cities in western North America, there is evidence that air
pollution is responsible for illness and mortality in Lower Mainland
residents. The report estimates that between 15 and 150 premature deaths per
year in the Lower Mainland may be attributable to air pollution. That is
about the same as the number of deaths from HIV, accidental falls or traffic
accidents. However, 10 times as many deaths are attributable to smoking and 5
times as many to alcohol.
24. There is an order of magnitude of difference between the lower and upper limits in the estimates of deaths per year. Is this significant? Solution
In truth though, Vancouver has taken steps to reduce its air pollution problems (or at least try to diminish the ongoing damage.) For example, TransLink has instituted a program called the Air Care Program. Every vehicle being registered in the Lower Mainland must be "air cared" and pass a certain standard before their owners will be able to renew their insurance for that vehicle.
The program began in 1992 and since that time over 8.5 million inspections have occurred. Repairs done as a result of Air Care requirements are contributing to a reduction in the carbon dioxide levels in the area.
As well, all of Canada - including Vancouver and British Columbia - have pledged to make a conscious effort to follow the guidelines stated in the Kyoto Accord. In December 1997, Canada and more than 160 other countries met in Kyoto, Japan, and agreed to targets to reduce Green House Gas (GHG) emissions. The agreement that set out those targets, and the options available to countries to achieve them, is known as the Kyoto Protocol. Canada's target is to reduce its GHG emissions to 6 percent below 1990 levels by the period between 2008 and 2012. This is comparable to the targets taken on by our major trading partners.
Courtesy of: http://www.climatechange.gc.ca/english/whats_new/overview_e.html