
Section 2c - Probability distributions
Problem
I want to explore, with Fathom, the probabilities and their respective distributions
from the data attained from the MTO. I want to look at the probability distributions
of male and female drivers, the collisions of male and female drivers, and drivers
killed in collisions, all with respect to their ages. I would like to see whether I can
find any differences in these.Plan
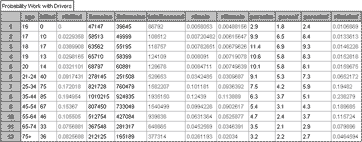
Using Fathom, I will create a collection chart entering the data from Table 2.2
and 2.20 from the MTO data. I will use Fathom to calculate relative frequencies
for male and female drivers as well as the relative frequency of drivers killed. The
relative frequencies for male and female drivers will take the total population into
consideration. I will then create graphs to look at the probabilities (we will use
relative frequency as the best estimate to the probability) calculated in the
collection chart. That is, the chart is a collection of data and the resulting
probabilities.
Data
Graph 1: Relative Frequency of Drivers Killed by Age Group
Graph 2: Relative Frequency of Female Drivers by Age Group
Graph 3: Relative Frequency of Male Drivers by Age Group
Graph 4: Percentage of Male Collisions by Age Group
Graph 5: Percentage of Female Collisions by Age Group
Graph 6: Percentage of Male and Female Collisions by Age Group
Analysis
Graph 1 shows a bell shaped curve showing that 35-44 year olds are killed more often in collisions. Graph 2 and Graph 3 show a bell shaped curve demonstrating a similar pattern in driving age population for both males and females, with most drivers on the road being between 35 and 44. Graph 4, 5, and 6 have a similar pattern concerning collisions by age group percentage. The highest probability of being in an accident whether you are male or female occurs when you are 18 years old.Conclusion
Graph 2 and 3 shows us the probability of finding a 35-44 year old driver is
highest amongst all driver age groups for both male and females. That is,
male and female 35-44 year olds make up the most drivers and thus we have
a greater probability of finding them on the road. Since they have the highest
population on the road, they also have the greatest probability of being killed
while driving. This is illustrated in graph 1. Looking at Graphs 4 we see that 18
year old males have the highest probability of males of being in a collision.
That is, the probability of being in a collision if you are an 18 year old male is
11.4%. From Graph 5, we see that 18 year old females have the highest
probability of females of being in a collision. That is, the probability of being
in a collision if you are an 18 year old female is 6.9 percent. Looking at Graph 6
we see that 18 year olds have the highest percentage concerning their
population involved in a collision. That is, the probability of being in a collision
if you are 18 years old is 9.3%. Almost 1 out of 10 18 year olds is involved in a
collision. This is important to note concerning the insurance prices for 18 year
olds.