The Measurement of Attitude
Chapter 5: Application of the Experimental Scale
L. L. Thurstone and E. J. Chave
Table of Contents | Next | Previous
SOME ACTUAL DISTRIBUTIONS OF ATTITUDE
While the scale developed in these experiments cannot be regarded as completely satisfactory, it is sufficiently diagnostic to make it worth trying on several groups for comparative purposes.
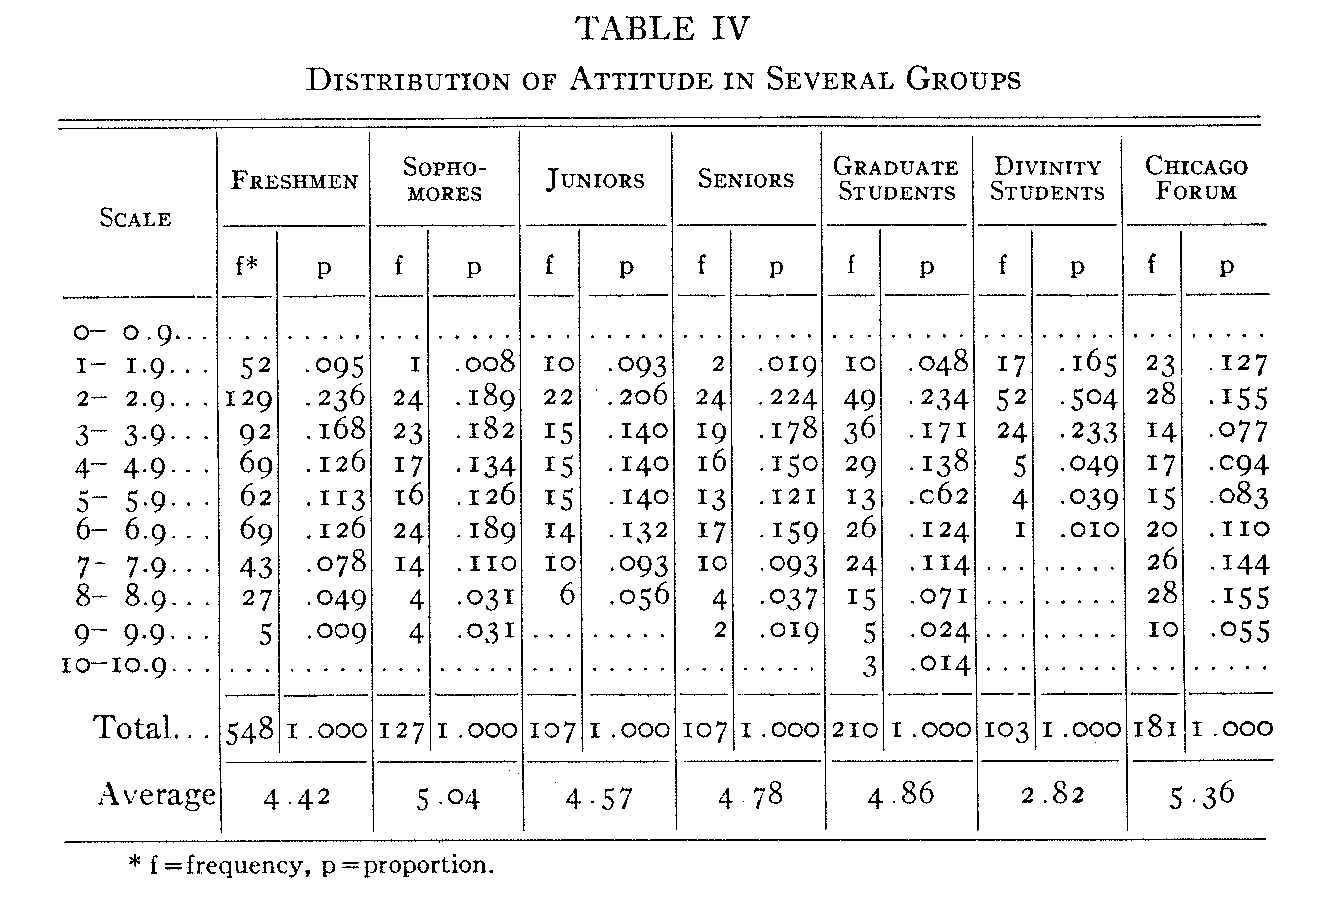
The scale was presented to students at the University of Chicago, both undergraduates and graduates, to some faculty members, and to the Chicago Forum. In Table IV the frequency distributions of scores are summarized and in Figure 18 these frequency distributions are shown graphically for the groups larger than one hundred subjects. All of these distributions have been reduced to the same area by expressing each class-frequency as a proportion of the entire group.
( 68)
The mean score for each group is indicated by a small arrow on the base line. Inspection of these frequency polygons shows immediately the wide range of attitude toward the church rep-
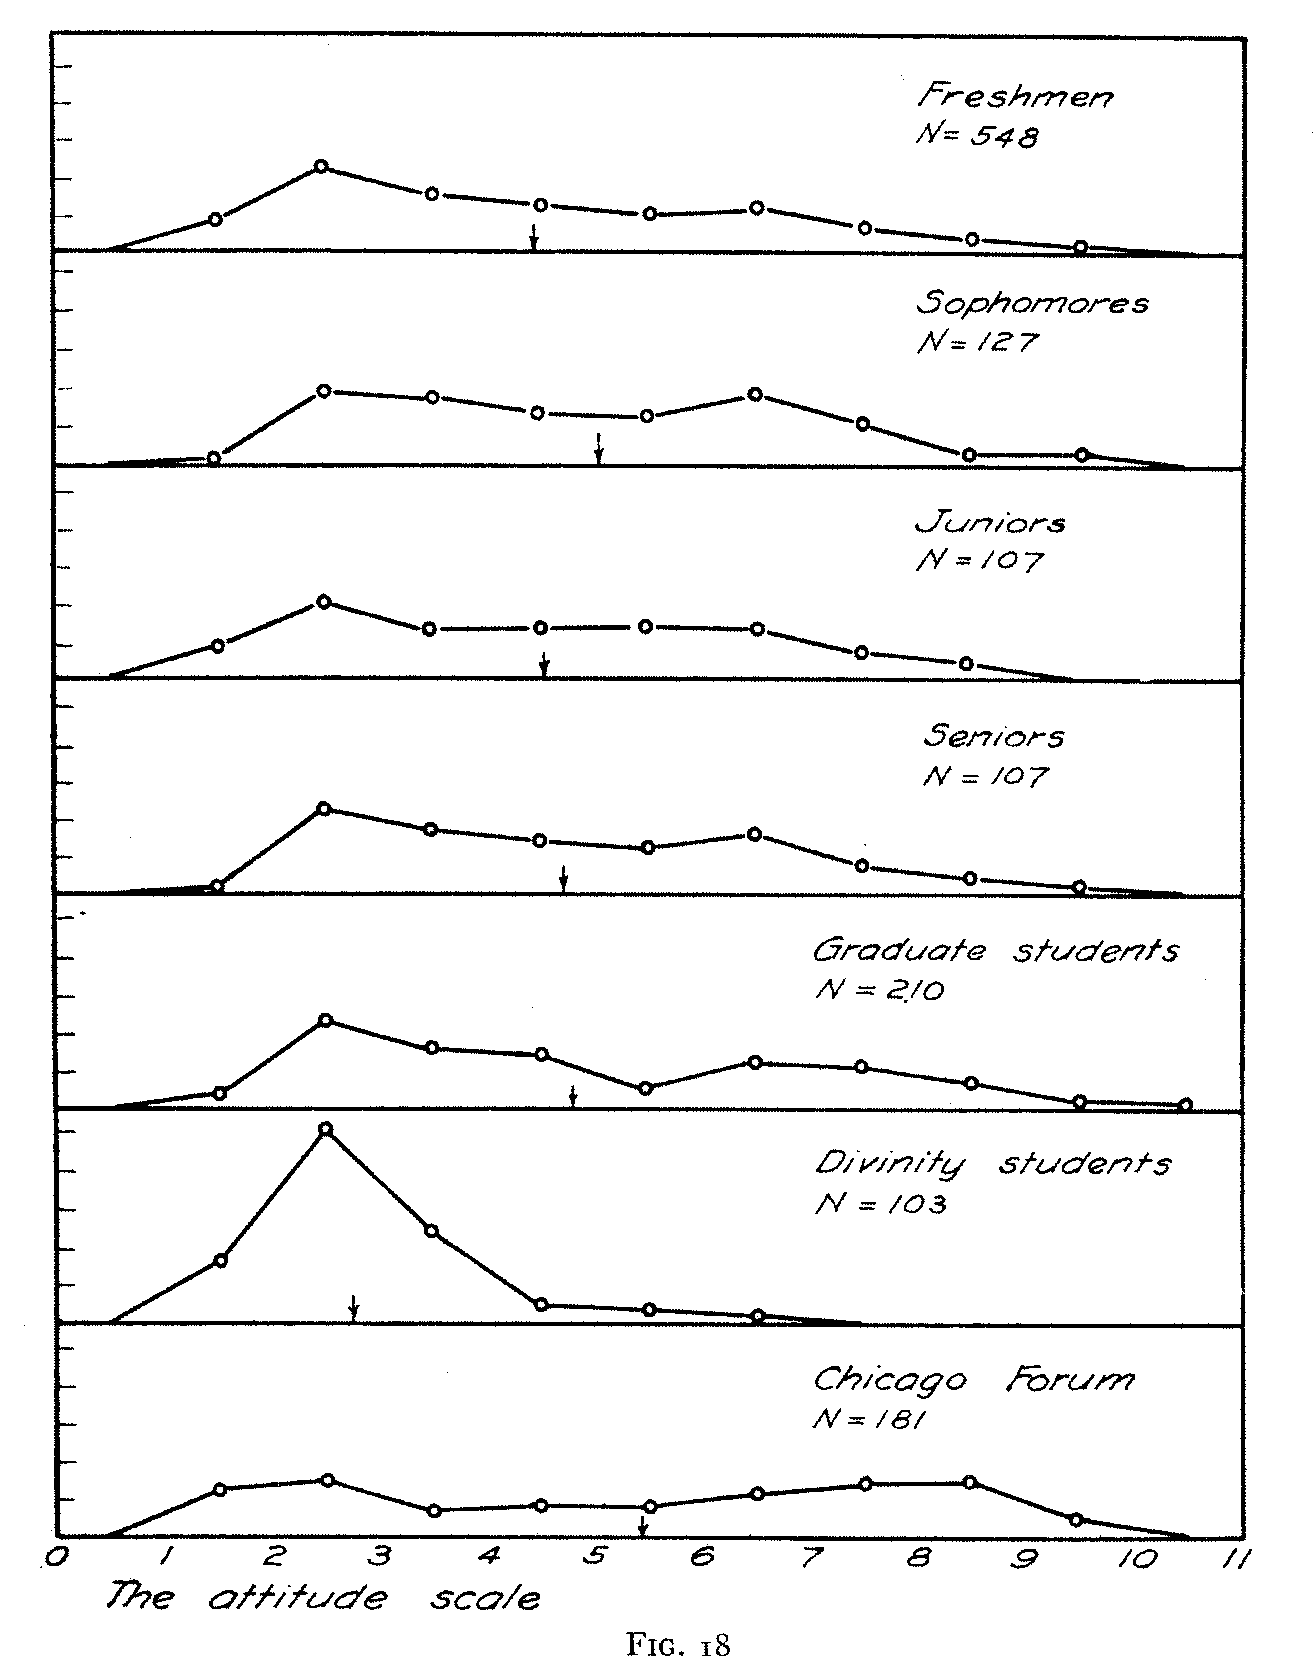
(69) -resented in all these groups. As is to be expected, the divinity students concentrate more strongly in favor of the church than any of the other groups. The Chicago Forum has the highest score, indicating that this group is, on the average, more frankly antagonistic to the church than any of the student groups. The four undergraduate classes do not show any distinct trend to be-come more in favor of or more against the church as they progress through college. The graduate students score about the same, on the average, as the undergraduate students. Our groups may not be large enough and our scale may not be sufficiently perfected to make these conclusions final.
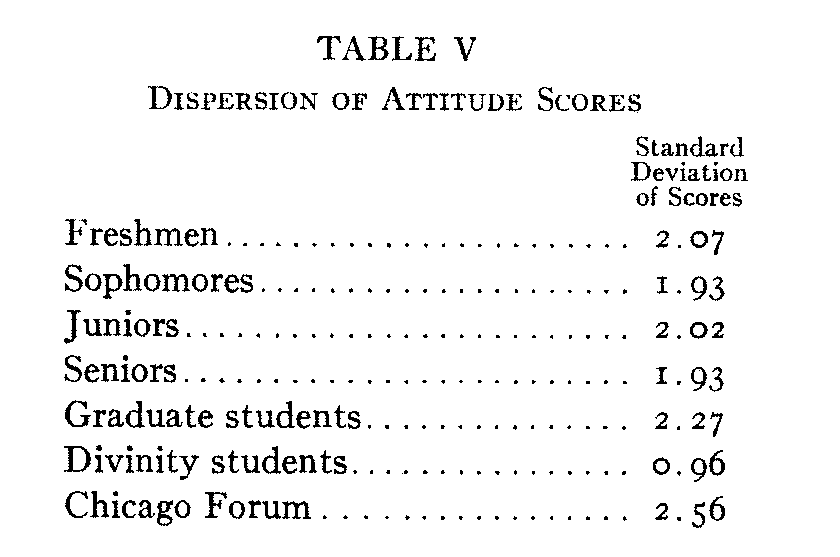
The several distributions represented in Figure i8 vary some-what in the dispersion of scores. In Table V the standard deviations are listed for the several distributions of scores on the experimental attitude scale. It will be seen that the dispersion of scores is approximately the same for the four undergraduate classes. The variability in attitude increases for the graduate students. The divinity students have the smallest scatter and the sample of 183 records from the Chicago Forum shows the widest scatter in attitude toward the church.
As a tentative application of the experimental scale, we have tabulated the frequency distributions for several groups which might conceivably differ in their attitudes toward the church. In
( 70)
Figure 19 we have the distributions for Jews, Protestants, and Catholics. Inspection of the distributions shows immediately that
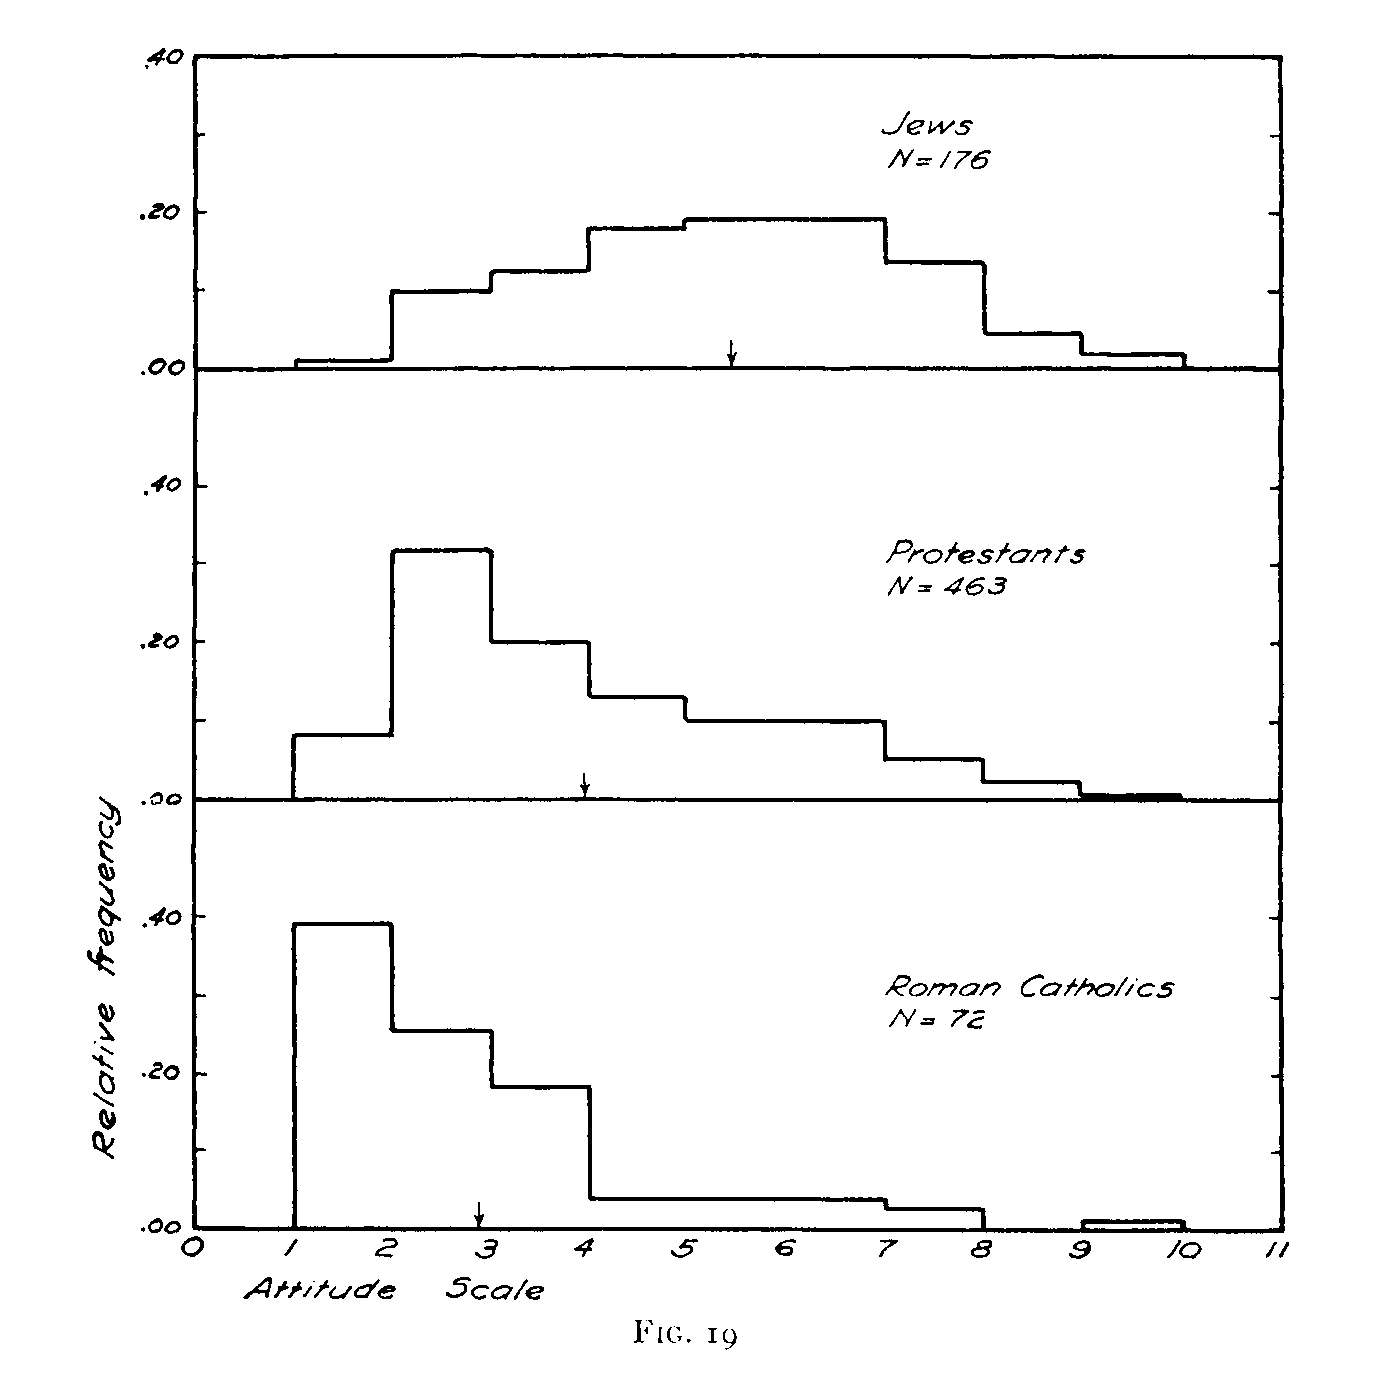
the Catholics are as a whole most strongly favorable toward the church. The Jews are as a whole more indifferent and more frequently antagonistic toward the church. The Protestants occupy an intermediate position on the scale. These results are probably what we should expect. The actual frequencies with the arithmetic mean for each distribution are summarized in Table VI.
( 71)
It should be noted that in drawing these frequency distributions we have reduced the areas of all the surfaces to unity. Each ordinate is therefore expressed in terms of relative frequency, i.e., the proportion of the whole distribution that is found in a class-interval. In this manner the sum of the relative frequencies for all the class-intervals must equal unity for each distribution. The purpose of this reduction is to facilitate the comparison of the dis-
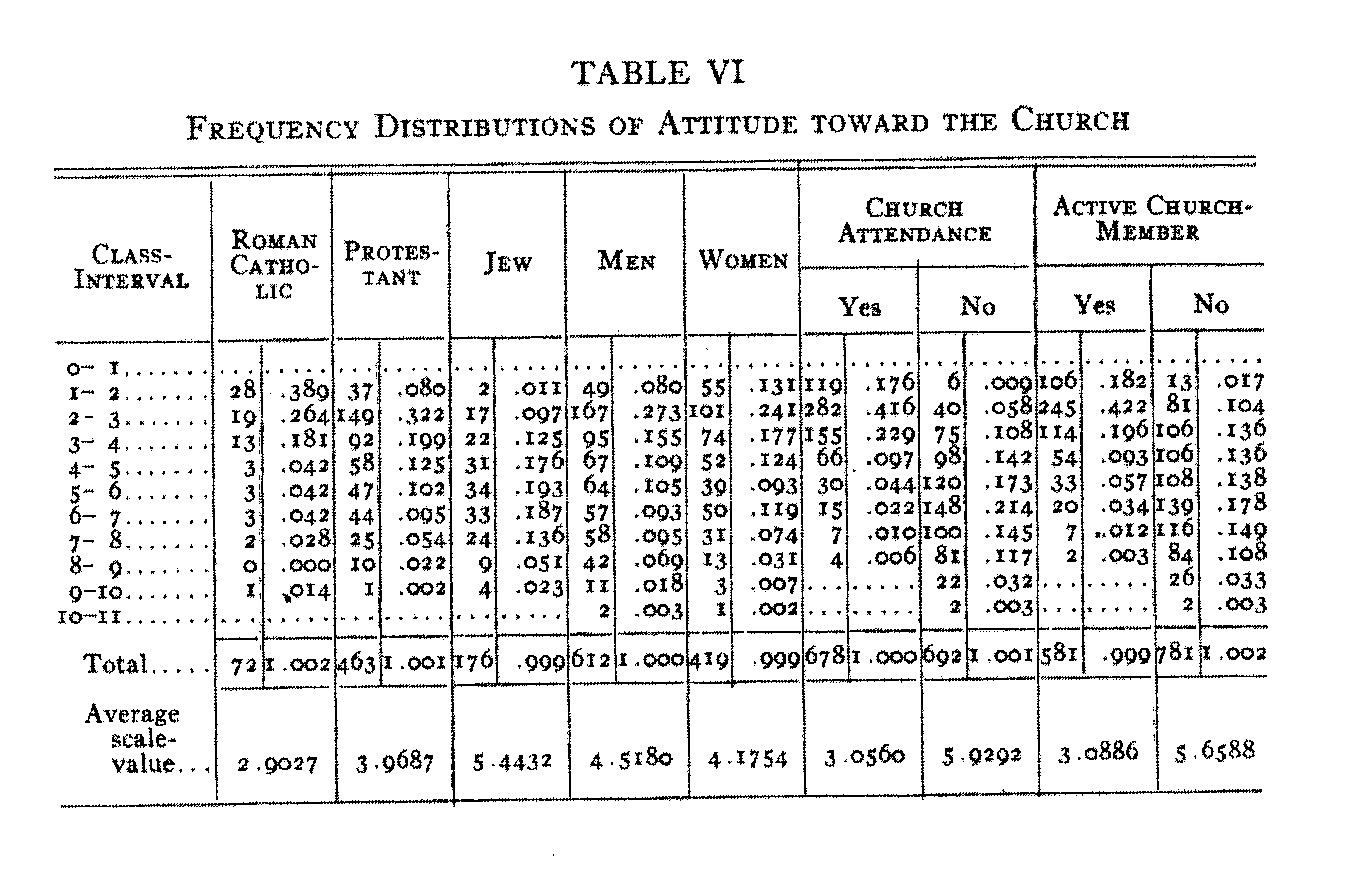
-tributions as to relative range and the location of the central tendency. If the distributions were drawn with the actual frequencies, they would of course be different in average height owing to the variation in the total number of cases in the several distributions. This might be a distraction in the inspection and comparison of the diagrams. The actual frequencies, are, however, presented in Table VI. In each of these frequency diagrams the arithmetic mean is represented by a small arrow on the base line. Its numerical value will be found in Table VI.
In Figure 20 we have a graphical comparison of men and women. These two frequency surfaces have been drawn in the
( 72) same manner as the preceding diagram. The spread is comparable for men and for women. The arithmetic means indicate that on the whole perhaps the women are slightly more favorable to the
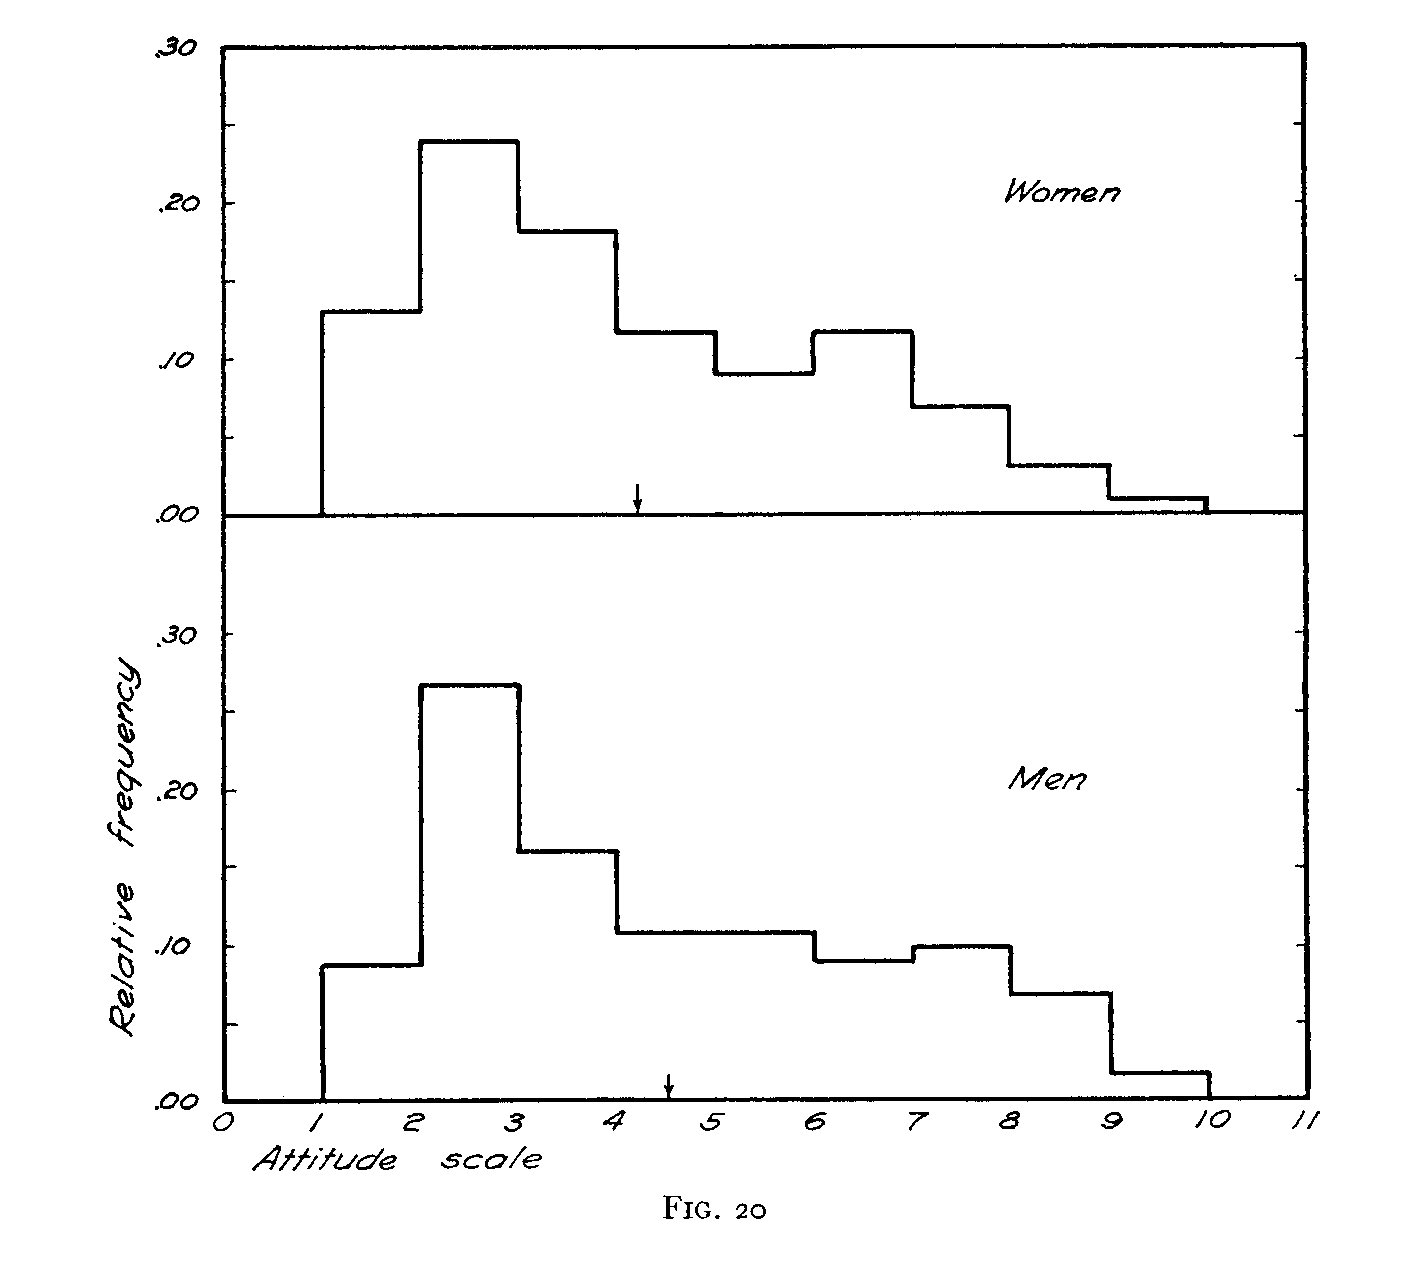
church than the men. The present distributions are drawn primarily in order
to illustrate the manner of using an attitude scale.
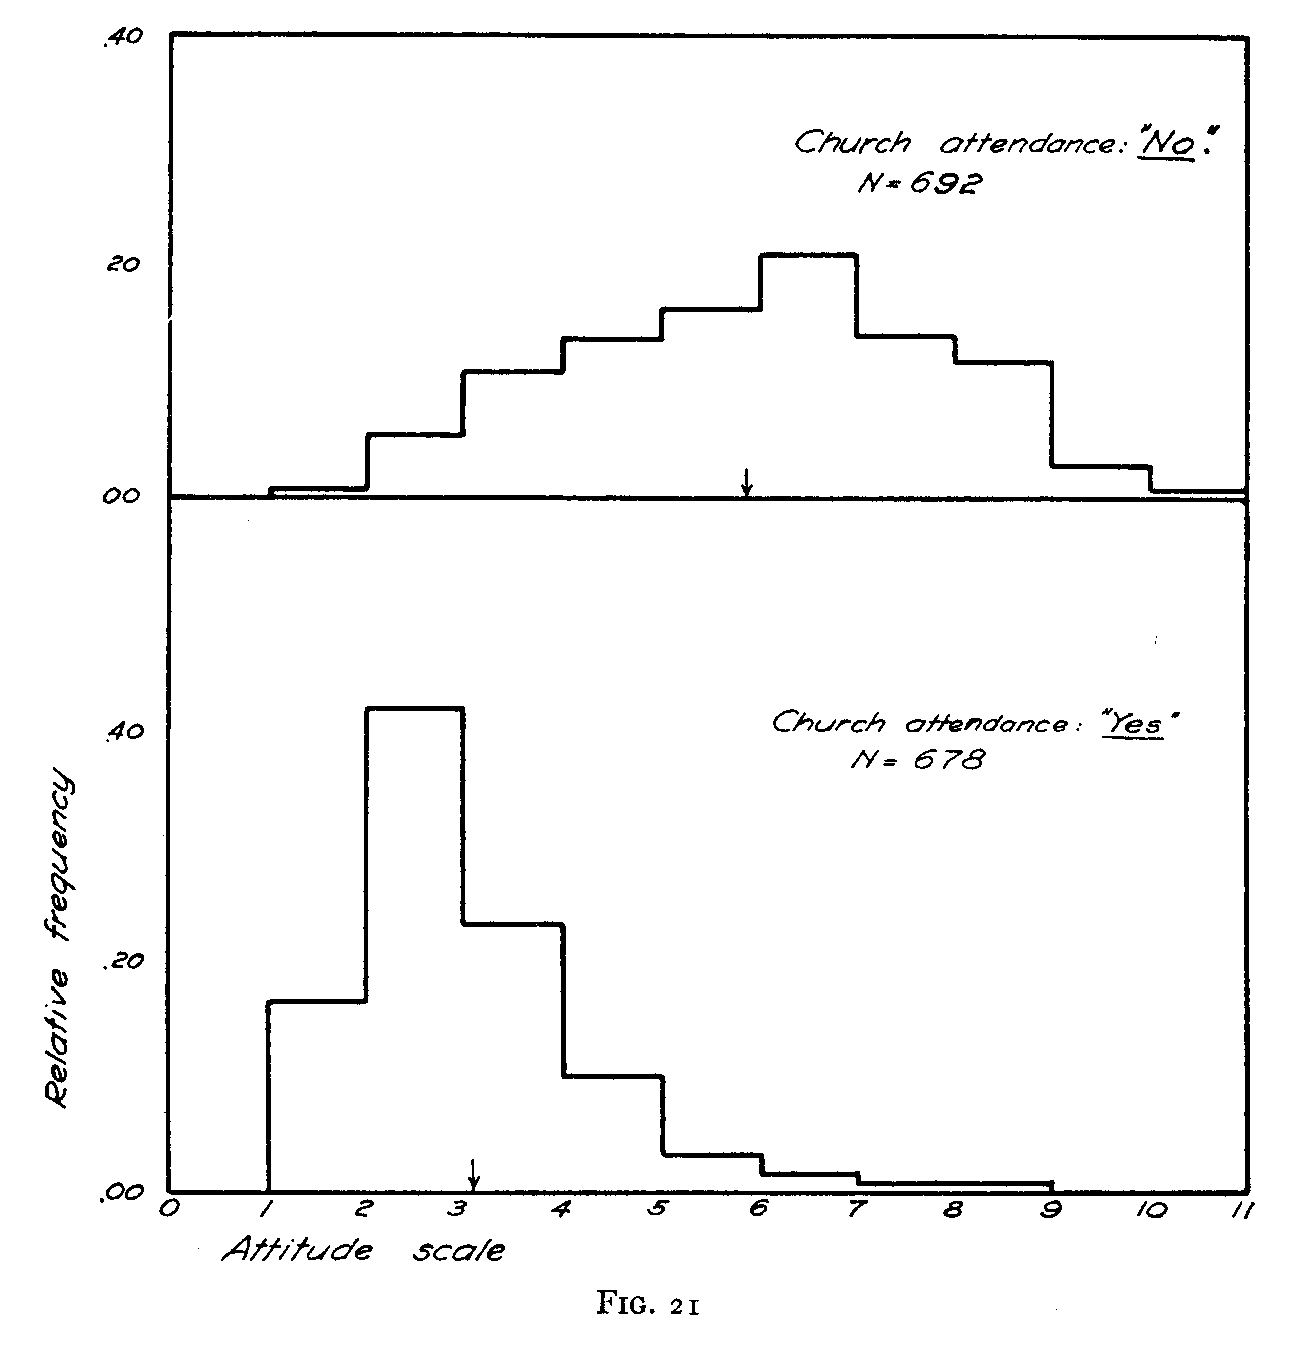
On the title page of the printed form of the experimental scale we asked each
subject whether or not he attended church frequently. The subjects who answered
this question were divided into two groups according to whether their answer to
this question was "yes" or "no." These two distributions of attitude are shown
( 73) in Figure 21. The two groups are comparable in size. It will be seen that there is a rather striking difference in the mean scale position of those who attend church frequently and of those who do not. This is, of course, as one would expect.
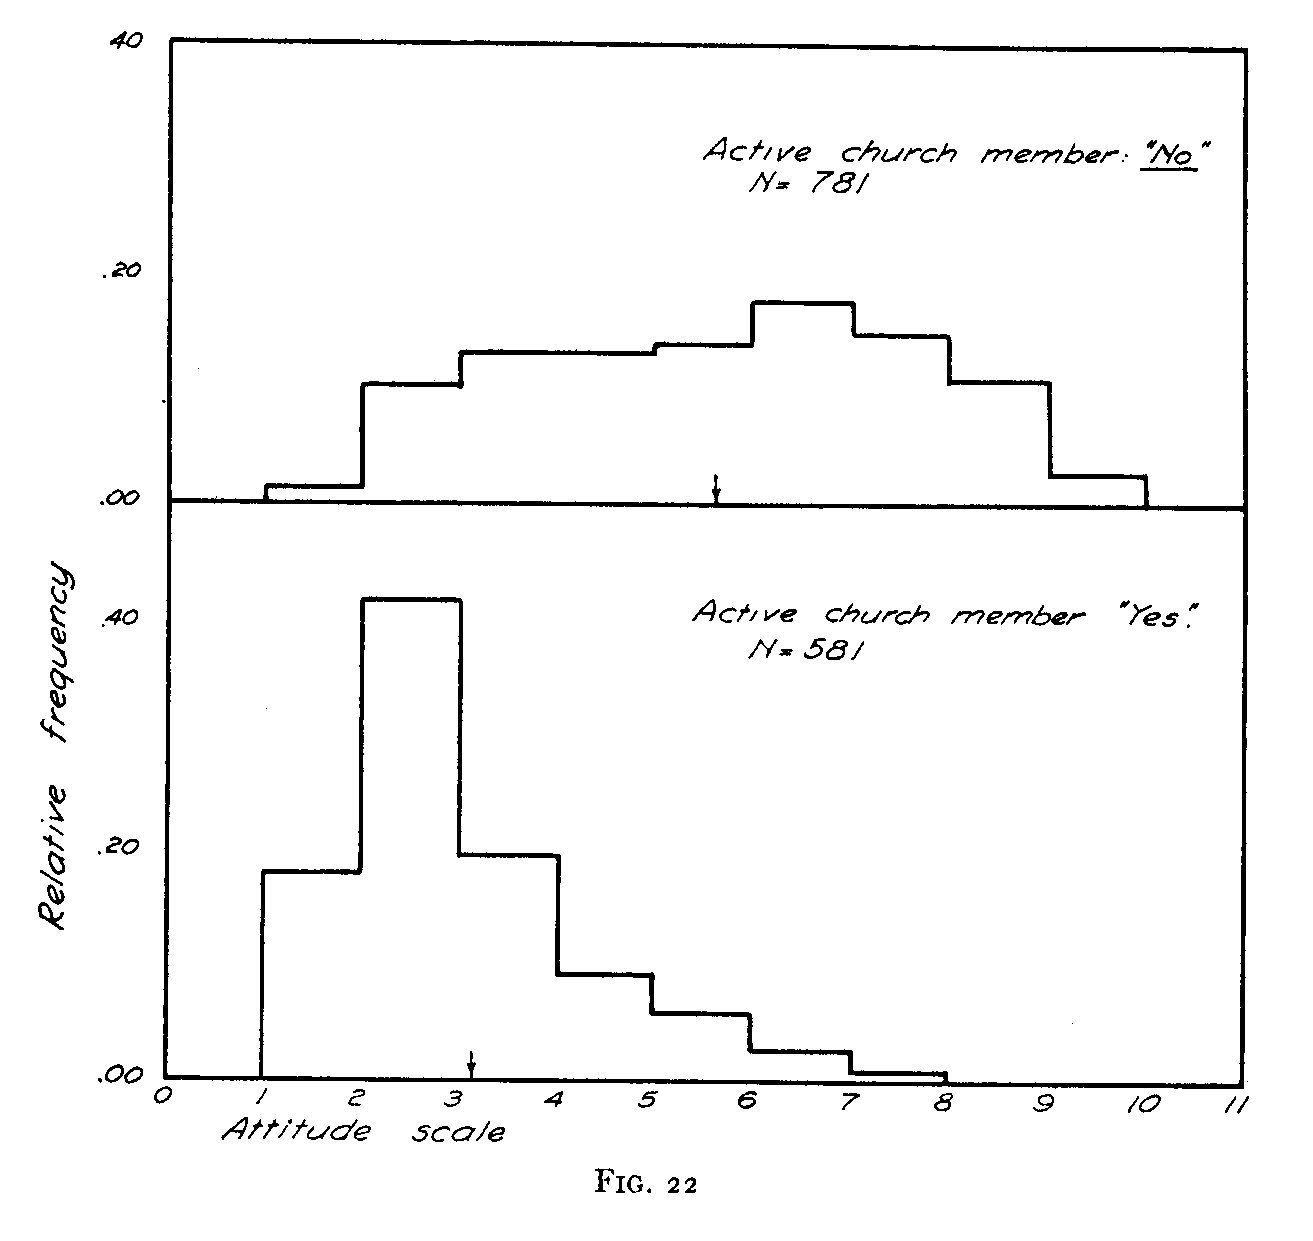
A similar difference is seen in Figure 22 between the attitudes of those who are active church-members and those who are not. These frequency distributions reveal nothing that would not be expected beforehand, but they indicate at least that the scale does not give absurd results when applied to situations about which we
( 74) can make a reasonable prediction. If the scale gives reasonable results in those groups whose attitudes toward the church are known before hand it is a fair inference that the same scale might be used with some assurance in measuring the attitudes of groups about which we cannot make predictions.
The validity of the unit of measurement for the attitude scale is not demonstrated by these frequency distributions. It is conceivable that results as differentiating as these might be obtained even if the scale consisted of nothing more than a series of statements arranged in rank order and numbered serially. To establish the validity of the unit of measurement is one of the most
( 75) important problems in the measurement of attitude. It can be done perhaps best by asking two groups of individuals who are known to differ in their attitude on the issue in question to sort a series of one hundred or more statements into the eleven piles. The scale-values should be ascertained independently for the two groups. Now if the two scales so produced give substantially the same scale-values for the statements, then we shall have experimental evidence that the attitudes of the people who sort the statements have a negligible effect on the scale itself. Such an experiment is now under way.
The method of equal-appearing intervals is used here not with-out realizing
its limitations. It has been used in the measurement of handwriting excellence
and of other educational products with-out admission by the authors that the
scale-values so obtained might not be valid. It is likely that the scale-values
are somewhat less valid than those obtained by the method of paired comparison
or its equivalent. I know of no published study of the discrepancies in
scale-values of educational products calculated by the two methods. Some crucial
experiments to determine the validity of the method of equal-appearing intervals
are now under way in the psychological laboratory of the University of Chicago.
ALTERNATIVE FORMS OF THE FREQUENCY DISTRIBUTIONS
One of our principal objectives in the measurement of attitude is to plot a frequency distribution of attitude which shall be descriptive of a group. A high ordinate of such a frequency distribution should indicate that the attitude represented by that part of the scale is relatively popular in the group in question and, similarly, a low ordinate should indicate that the attitude represented by that part of the scale is relatively unpopular in the particular group.
There are at least two different methods by which these frequency distributions may be plotted, and they are both illustrated in Figure 23 for the same group and for the same scale. It is of
( 76) course possible to tabulate a frequency distribution of scores and to represent this distribution graphically. This is shown in the
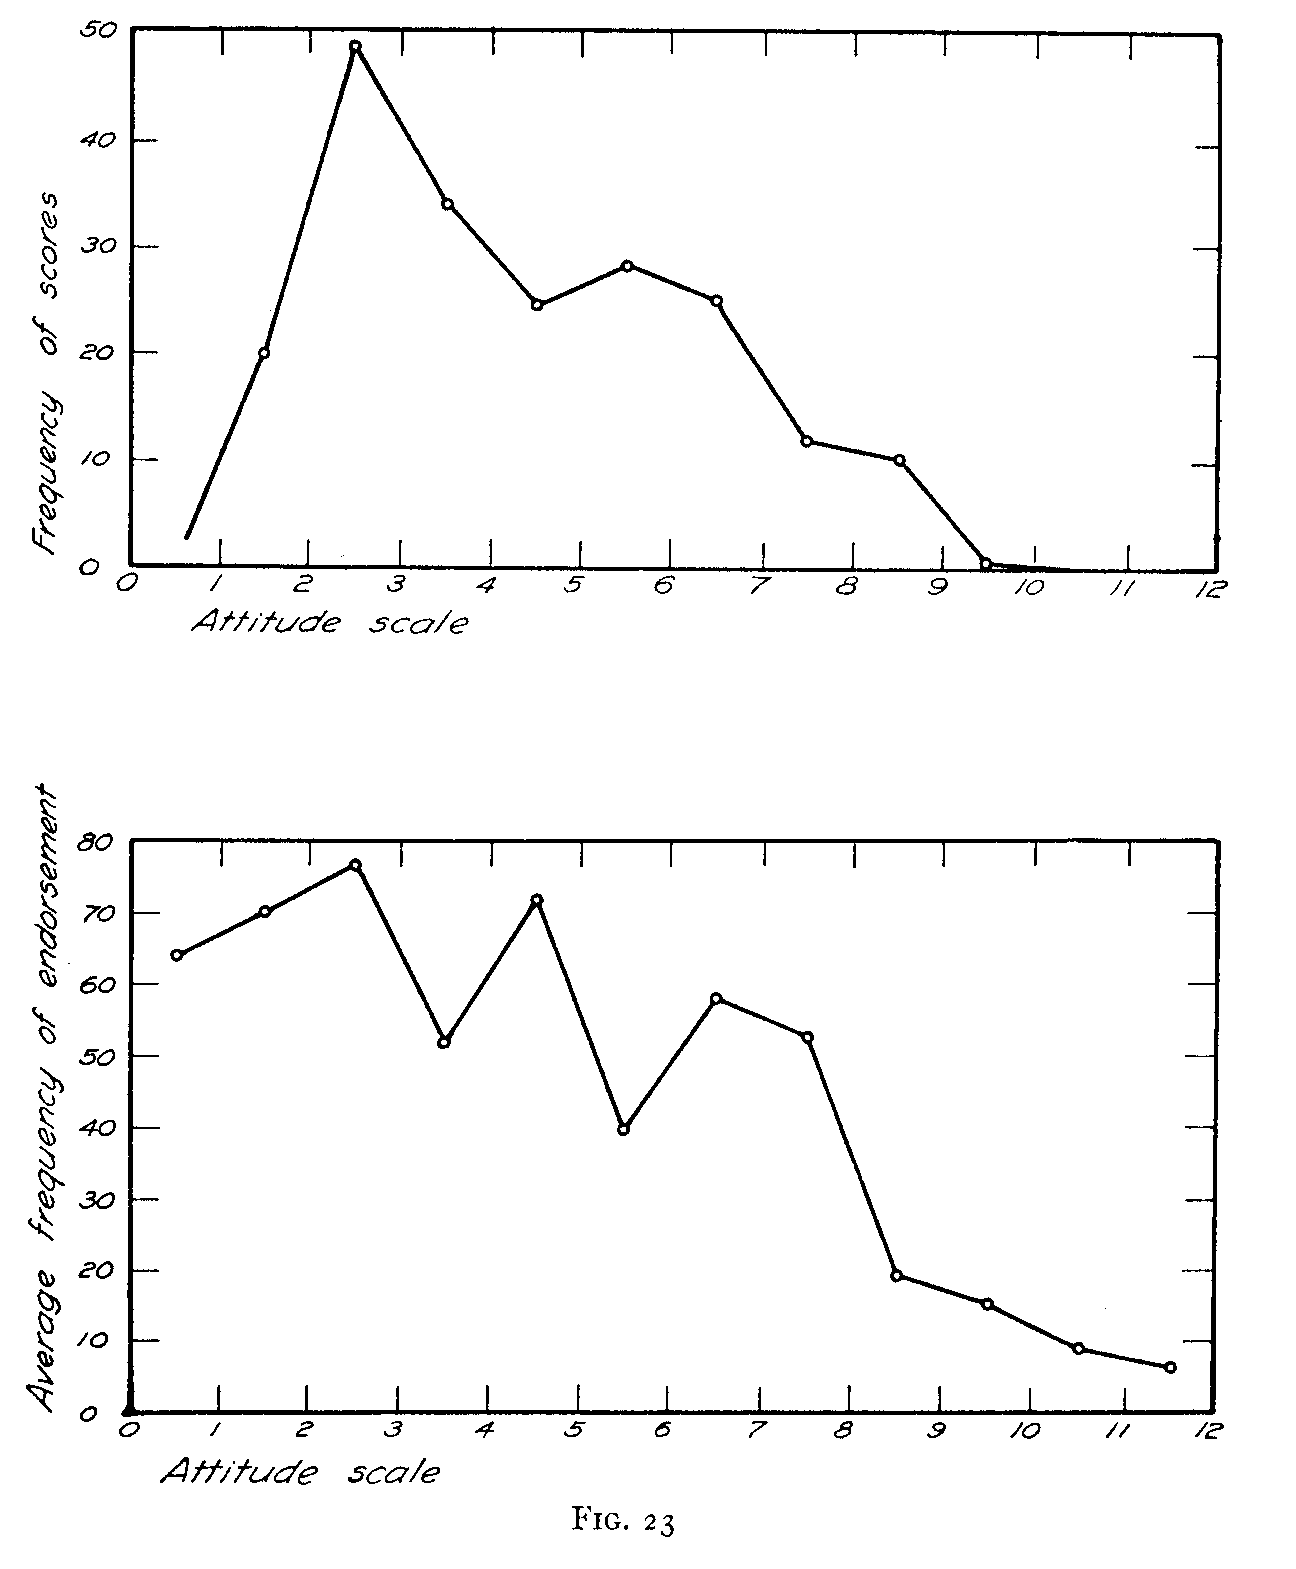
upper part of Figure 23. The area of such a diagram represents the total number of individuals in the group, and the ordinate for
( 77) any particular class-interval represents the actual number of individuals whose scores fall in that class-interval. The interpretation of such a frequency polygon is relatively simple.
Another method is to calculate the average number of indorsements per statement in each class-interval and to plot a distribution with these values as ordinates. The area of such a frequency diagram will be proportional to the number of indorsements made by the whole group to all of the statements in the scale if the opinions in the scale are evenly graduated. This type of distribution is shown in the lower part of Figure 23 for the same group and for the same scale.
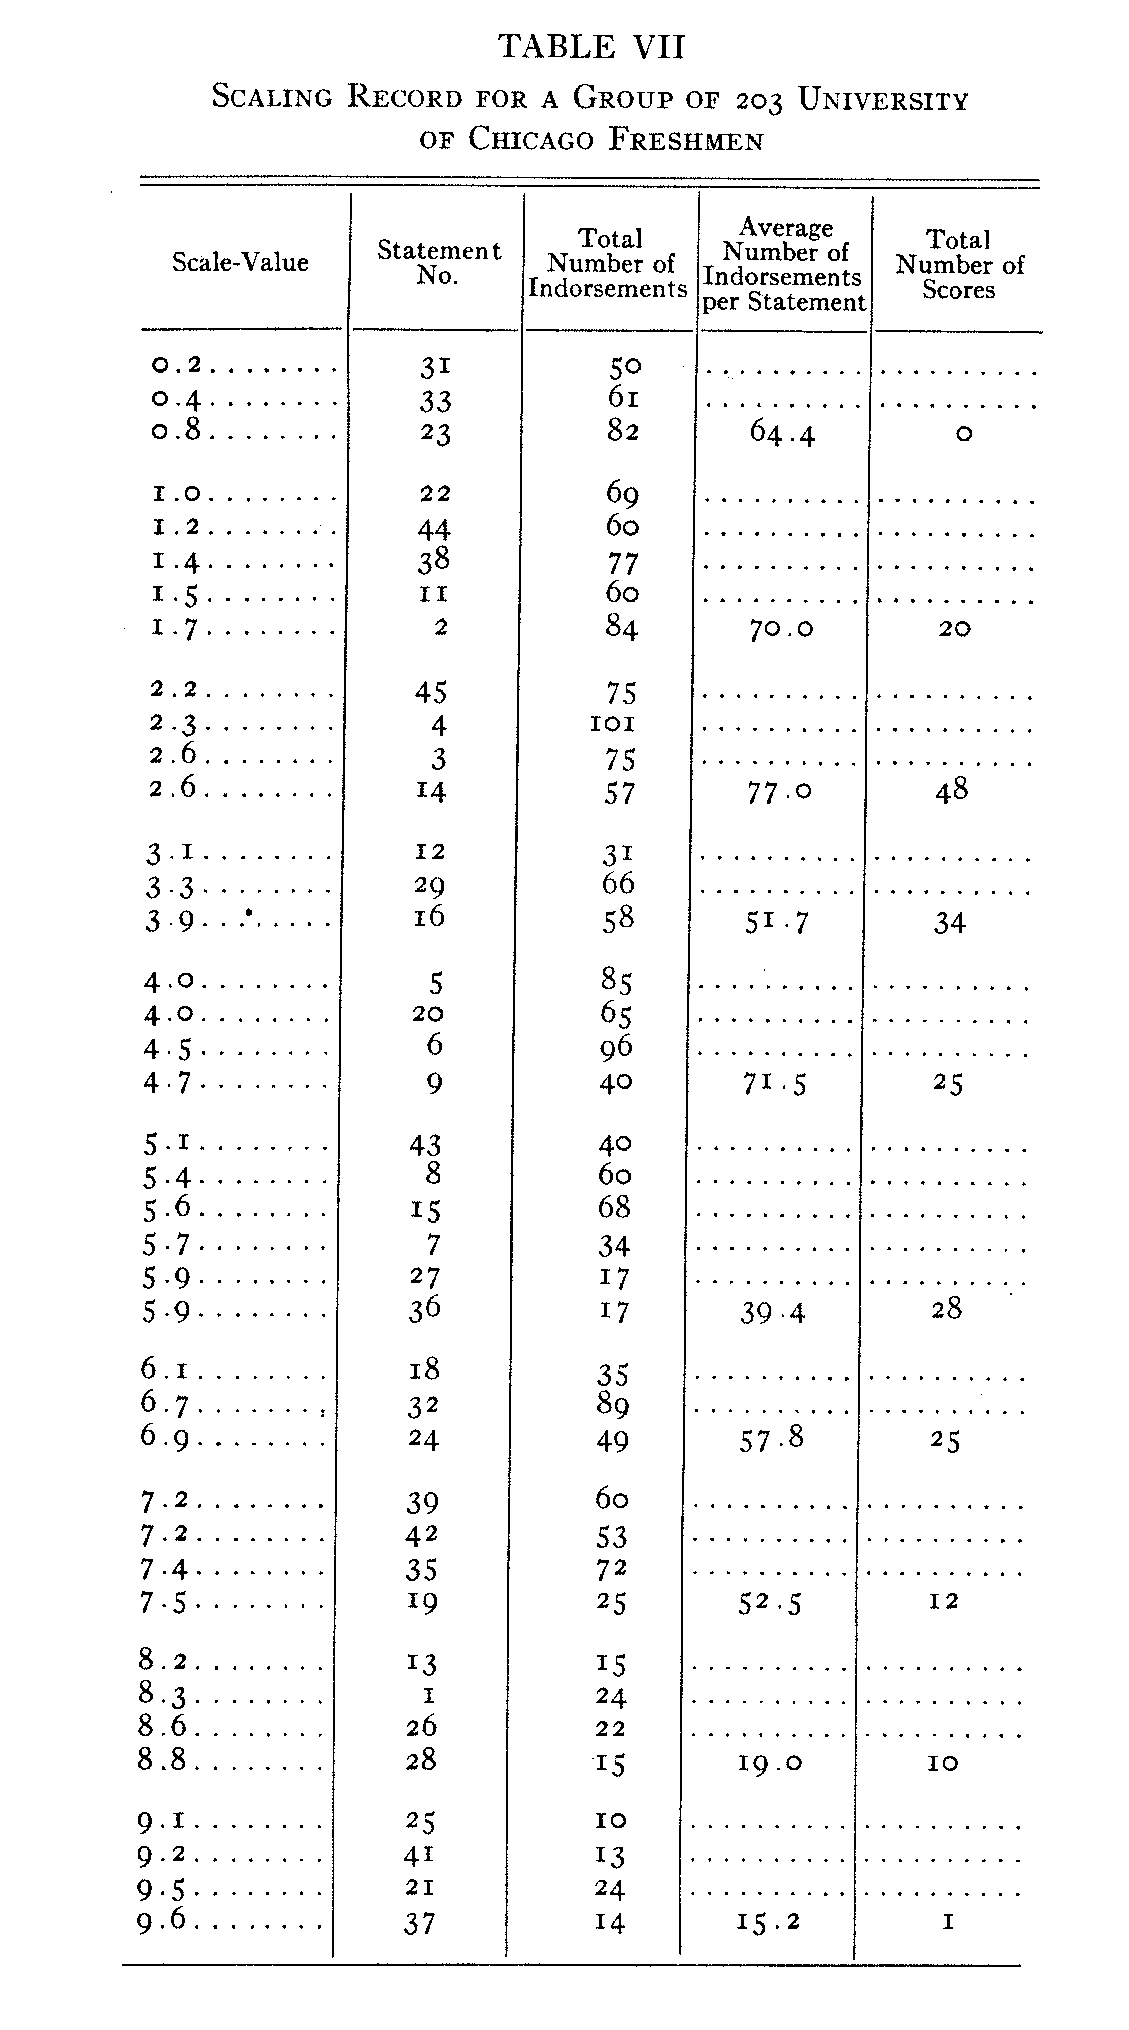
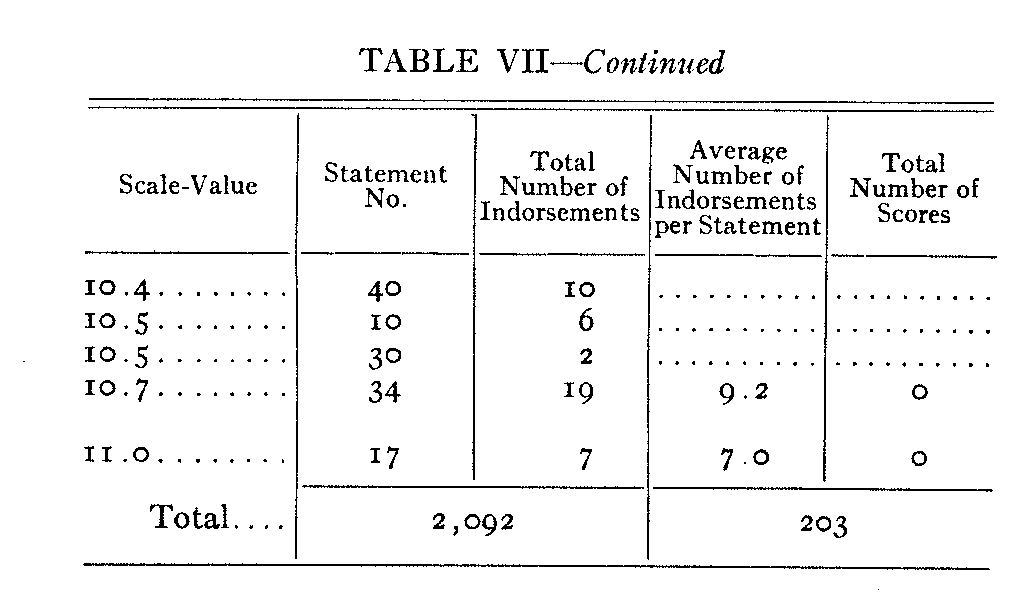
The numerical values from which the two diagrams of Figure 23 were plotted are shown in Table VII. In the first column are recorded the scale values of the respective statements. In the second column are listed the code numbers of the statements. The third column shows the total number of indorsements for each of the statements in a group of 203 University of Chicago Freshmen whose papers were drawn at random from the total of 5.48 records specially for the purpose of comparing these two types of frequency distributions. For example, the first line of Table VII shows that statement 31 has a scale value of 0.2 and that it was given 50 indorsements by the present group of 203 freshmen. The first entry in the fourth column shows that the average number of indorsements per statement in the first class-interval was 64.4. It is merely the average of the entries 50, 6i, and 82. The second entry of the last column shows that there were 20 students in the present group whose scores on the scale were between i and 2. The rest of the table is interpreted in the same manner. The upper part of Figure 23 is plotted directly from the last column of Table VII, and the lower diagram is plotted from the entries in the fourth column of the table.
It would seem that either of these two methods of drawing the frequency distribution of attitude might be justified. One of them shows the frequency distribution of individual scores with a total
( 78)
( 79)
area equal to the number of individuals in the group. The other shows the average relative popularity of the statements in each class-interval. The total area of this surface is proportional to the total number of indorsements when the statements are exactly evenly graduated on the scale.
It is clear that the spread of the lower diagram must be greater than the
upper diagram of scores because statements may be indorsed even when they are
too extreme to constitute any person's score. It is our present belief that the
upper diagram shows the preferable way of representing the distribution of
attitude in a group. It is perhaps the simpler to explain or to interpret. It is
merely the frequency distribution of scores on an attitude scale.
CORRELATION BETWEEN THE ATTITUDE SCORES AND SELF-RATINGS
On the title page of the experimental attitude scale we inserted a graphic rating scale. This scale consists merely of a horizontal line across the page on which we asked the subject to indicate by a cross where he estimated his own attitude to be. At one end of this line was printed the phrase, "Strongly favorable to the church" ; at the middle of the line was printed the word "Neutral"; and at the other end of the line there was the phrase "Strongly against the church." Not enough instruction was given
( 80) in the use of a self-rating scale to make this record of much consequence, but we included it for what it might be worth.
When the papers were scored for the attitude scale a record was also made of the tenth of the horizontal line in which the subject had placed a cross to indicate where he estimated his own attitude to be. It is of course to be expected that there should be correlation between the score on the attitude scale and the position of the check mark or cross on the self-rating line. The correlation between the score on the attitude scale. and the tenth of the line in which the self-rating check occurred was found to be 0.67, which is fairly satisfactory.
We have no estimate of the reliability of these self-ratings and consequently we cannot make any significant inference from this correlation. Any interpretation would also be subject to the ambiguity that this correlation may be called an index of the validity of the attitude scale in terms of the self-ratings as a criterion, or it may be called an index of the validity of the self-ratings in terms of the attitude scale as a criterion. In either case, taken at its worst, the correlation between these two indices is closer than the correlation between most psychological tests and their respective criteria. It was frequently found that a subject would rate himself as "neutral" on the self-rating line and check most of the statements strongly against the church in the attitude scale. This happened very frequently. In fact we believe we are justified in our inference that a subject will usually call himself slightly more favorable to the church than is indicated by the actual statements that he indorses. Perhaps this is because of the social pressure against the outspoken denial of the institutions that most people hold in high respect. It may also be that some of our subjects failed to understand the scale and interpreted "neutral" to mean complete or active indifference to the church.
SUMMARY OF APPLICATIONS
The practical application of the present measurement technique consists in presenting the final list of statements of opinion
( 81) to the group to be studied with the request that they check with plus signs all the statements with which they agree and with minus signs all the statements with which they disagree. The score for each person is the average scale-value of all the statements that he has indorsed. In order that the scale be effective toward the extremes, it is advisable that the statements in the scale be ex-tended in both directions considerably beyond the attitudes which will ever be encountered as mean-values for individuals. When the score has been determined for each person by the simple summation just indicated, a frequency distribution can be plotted for the attitudes of any specified group.
The reliability of the scale can be ascertained by preparing two parallel forms from the same material and by presenting both forms to the same individuals. The correlation between the two scores obtained for each person in a group will then indicate the reliability of the scale. Since the heterogeneity of the group affects the reliability coefficient, it is necessary to specify the standard deviation of the scores of the group on which the reliability coefficient is determined. The standard error of an individual score can also be calculated by an analogous procedure.
The unit of measurement in the scale when constructed by the procedure here outlined is not the standard discriminal error projected by a single statement on the psychological continuum. Such a unit of measurement can be obtained by the direct application of the law of comparative judgment, but it is consider-ably more laborious than the method here described. The unit in the present scale is a more arbitrary one, namely, one-eleventh of the range on the psychological continuum which covers the span from what the readers regard as extreme affirmation to extreme negation in the particular list of statements with which we start. Of course the scale-values can be determined with reliability to fractional parts of this unit. It is hoped that this unit may be shown experimentally to be proportional to a more precise and more universal unit of measurement, such as the standard discriminal error of a single statement of opinion.
( 82)
It is legitimate to determine a central tendency for the frequency distribution of attitudes in a group. Several groups of individuals may then be compared as regards the means of their respective frequency distributions of attitudes. The differences between the means of several such distributions may be directly compared be-cause of the fact that a rational base line has been established. Such comparisons are not possible when attitudes are ascertained merely by counting the number of indorsements to separate statements whose scale differences have not been measured.
In addition to specifying the mean attitude of each of several groups, it is also possible to measure their relative heterogeneity with regard to the issue in question. Thus it will be possible, by means of our present measurement methods, to discover for ex-ample that one group is 1.6 more heterogeneous in its attitudes about prohibition than some other group. The heterogeneity of a group is indicated perhaps best by the standard deviation of the scale-values of all the opinions that have been indorsed by the group as a whole rather than by the standard deviation of the distribution of individual mean scores. Perhaps different terms should be adopted for these two types of measurement.
The tolerance which a person reveals on any particular issue is also subject to quantitative measurement. It is the standard deviation of the scale-values of the statements that he indorses. The maximum possible tolerance is, of course, the indorsement of all the statements throughout the whole range of the scale.
If it is desired to know which of two forms of appeal is the more effective on any particular issue, this can be determined by using the scale before and after the appeal. The difference between the individual scores, before and after, can be tabulated and the average shift in attitude following any specified form of appeal can be measured.
The essential characteristic of the present measurement method is the scale
of evenly graduated opinions so arranged that equal steps or intervals on the
scale seem to most people to represent equally noticeable shifts in
attitude.