A Time-saving Device for the Construction of Attitude Scales1
Robert H. Seashore and Kate Hevner
It is the purpose of this study to demonstrate a time- and labor-saving device for obtaining subjective ratings of stimuli by the method of equal-appearing intervals. The device may have some importance because it is especially applicable to the making of attitude scales after the method de-
( 367) -vised by Thurstone and used in making the scales published by the University of Chicago Press.
In connection with a research program in music appreciation the experimenters wished to devise a scale for attitude toward music, or opinion about the value of music, and it was decided to follow the procedure outlined by Thurstone and Chave (1) in their monograph, "The Measurement of Attitudes."... This procedure involves the following steps:
1. The defining of the attitude variable. This was defined roughly as the value music has for any individual, or more concretely, the amount of time and money he would be willing to spend on music.[2]
2. The selection of experimental material. Over 200 statements were collected by consultation and reading, from which a selection of 100 statements of possible reactions toward music was made, on the basis of their interest; unity of idea, clearness, and relevance.
3. The assignment of scale values. The 100 statements were given in mimeographed form to 150 subjects, who rated or sorted them by the method of equal-appearing intervals into nine classes on the basis of the different degrees of value they expressed for music.
4. The selection of the 40 best items to be retained in the scale. A tentative scale of 55 items had been selected on the basis of (1) clearness of diction, (2) ambiguity (Q values), and (3) range of scale values. These 55 statements were presented to 100 additional subjects who checked all the items with which they were in agreement, and from these results two further checks were made, and 15 more of the statements were eliminated.
5. The establishment of the reliability and validity of the scale. The self-correlation gives a satisfactory coefficient of reliability for comparisons of group differences (approximately .80).
The new labor-saving device was introduced in connection with the third step, the sorting of the slips into the nine equal-appearing intervals. In accordance with the standard procedure, 75 of the 150 subjects were given an envelope containing the 100 statements printed on separate slips, the
(
368) nine cover slips lettered A, B, C, D, the nine paper clips, and
directions as follows:
INSTRUCTIONS FOR SORTING
1. The enclosed hundred slips contain statements in regard to the value of music.
2. We are going to include some of them in making a scale that may later be used to measure the attitude toward music of people of different ages, training, geographical location, etc.
3. As a first step in making this scale, we want a number of persons to sort these slips into nine piles.
4. You are given nine slips with letters on them, A, B, C, D, E, F, G, H, I. Please arrange these before you in regular order. On slip "A"put those statements which you believe express the highest appreciation of the value of music. On slip "E" put those expressing a neutral position. On slip "I" put those slips which express the strongest depreciation of music. On the rest of the slips arrange statements in accordance with the degree of appreciation or depreciation expressed in them.
5. This means that when you are through sorting you will have nine piles arranged in order of value estimate, from A the highest, to I the lowest.
6. You may, if you prefer, proceed by first sorting the slips roughly into three piles ("appreciation," "more or less neutral," and "depreciation"), and then re-sorting each of these three piles into three subdivisions to get the full nine piles.
7. Do not try to get the same number in each pile. They are not evenly distributed.
8. The numbers on the slips are code numbers simply the result of a chance arrangement, and have nothing to do with the arrangement of the piles.
9. You will find it easier to sort them if you look over a number of slips chosen at random before you begin to sort.
10. It will probably take you about forty minutes to sort the slips until you are entirely satisfied with your distribution.
11. When you are through sorting, please clip the piles together, each with its letter slip on top. Replace the nine sets clipped carefully in the big envelope, and write your name and section on the outside.
The other 75 subjects were given the same statements printed on nine pages, with letters in the left-hand margin as in the sample below, and with paragraphs 3, 4, 5, and 6 revised and condensed into 3 and 4 as follows:
3. As a first step in making this scale we want a number of persons to rate these statements by assigning them to nine different classes.
4. We will call these classes A, B, C, D, E, F, G, H, and I, and you will find these letters directly to the left of each statement. If you find a statement which you believe expresses the highest appreciation of the value of music, underline the letter A. For a statement which seems neutral or non-committal
(369) underline E (the middle letter), while for those statements which express the strongest depreciation of music, underline I. Other degrees of appreciation or depreciation may be indicated by underlining one of the other possible letters to represent intermediate ratings.
ABCDEFGHI[3](22) I believe that if students devoted more time to enjoyment of music and less to acquiring information in intellectual subjects they would be better equipped for life after college.
ABCDEFGHI (23) Music stimulates and encourages me in my life and work.
ABCDEFGHI (24) To me music is of no greater or lesser importance than any of the other arts and sciences.
The results from the two different methods, sorting according to the standard procedure, and rating according to the new directions, were tabulated separately and the two cumulative frequency curves for each statement (representing the number of times it was placed on the piles from 1 to 9) were plotted on the same base line. The medians, which represent the scale values of the statements were read directly from these curves, and, in a few cases, where more than 50% of the subjects placed the statement on the end piles, the curve was extrapolated by approximation. The semi-interquartile range (Q) for each statement, which indicates the differences or spread of opinion in regard to it, was also read directly from each of these curves.
In terms of the sorting method, which has been the standard procedure, the rating method was a very close approximation from every point of view. Inspection showed that the shapes of the two curves were surprisingly similar. Significant details were always present in both. Overlapping and identity were the rule, and in very few cases was there any real difference apparent to the eye.
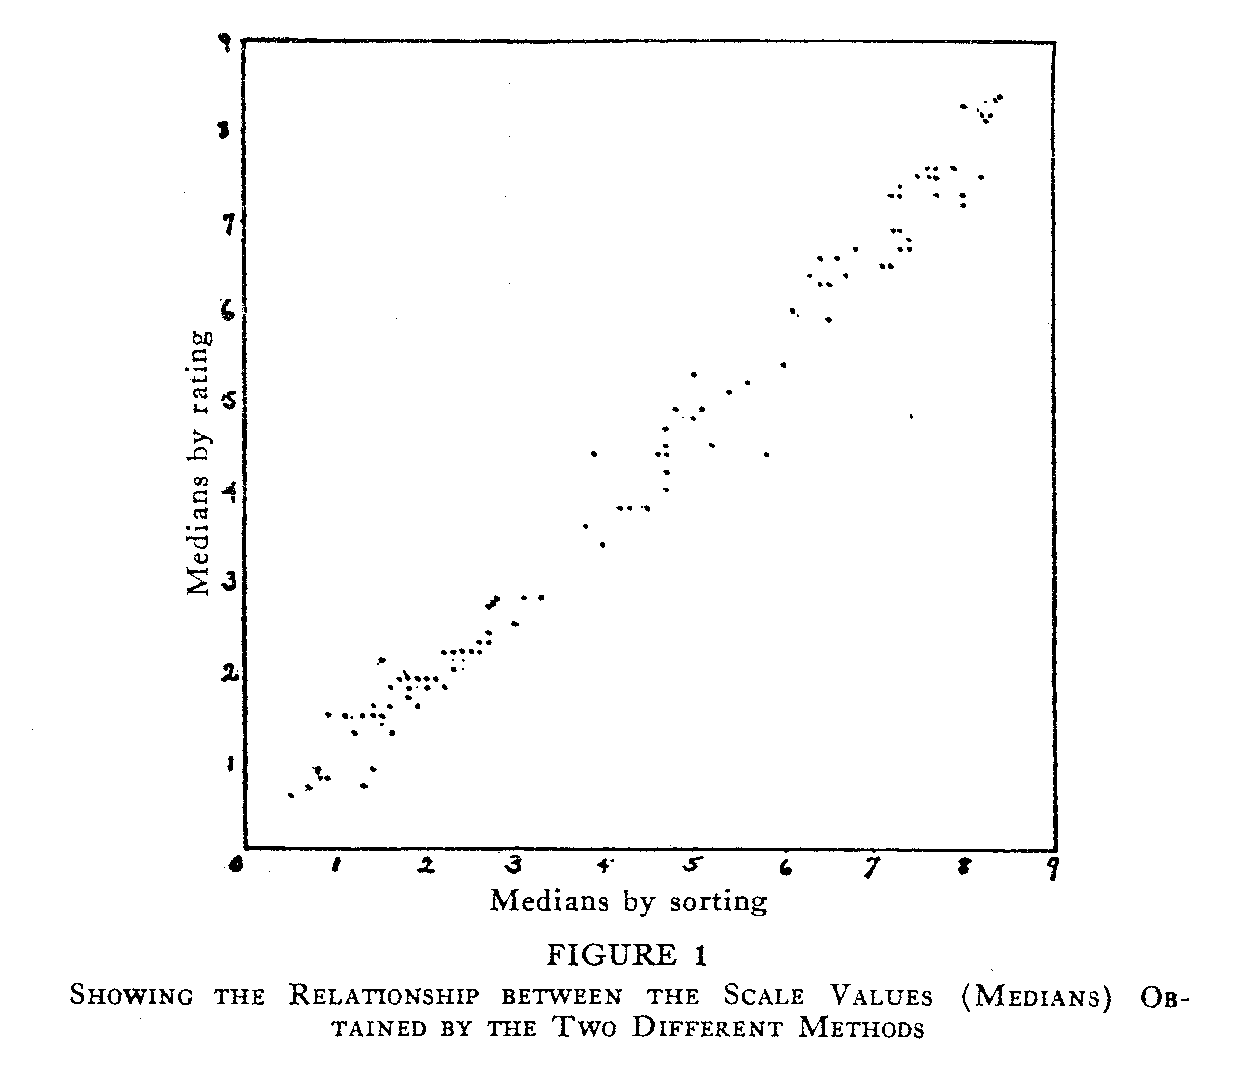
Figure 1 shows the plot of the medians for the two methods, and the close approximation to the straight line relationship is very apparent. The 45-degree angle of the plot indicates also that the constant tendency to raise or lower the medians in either method is negligible, and that the deviations between the medians are about equal in all parts of the range.
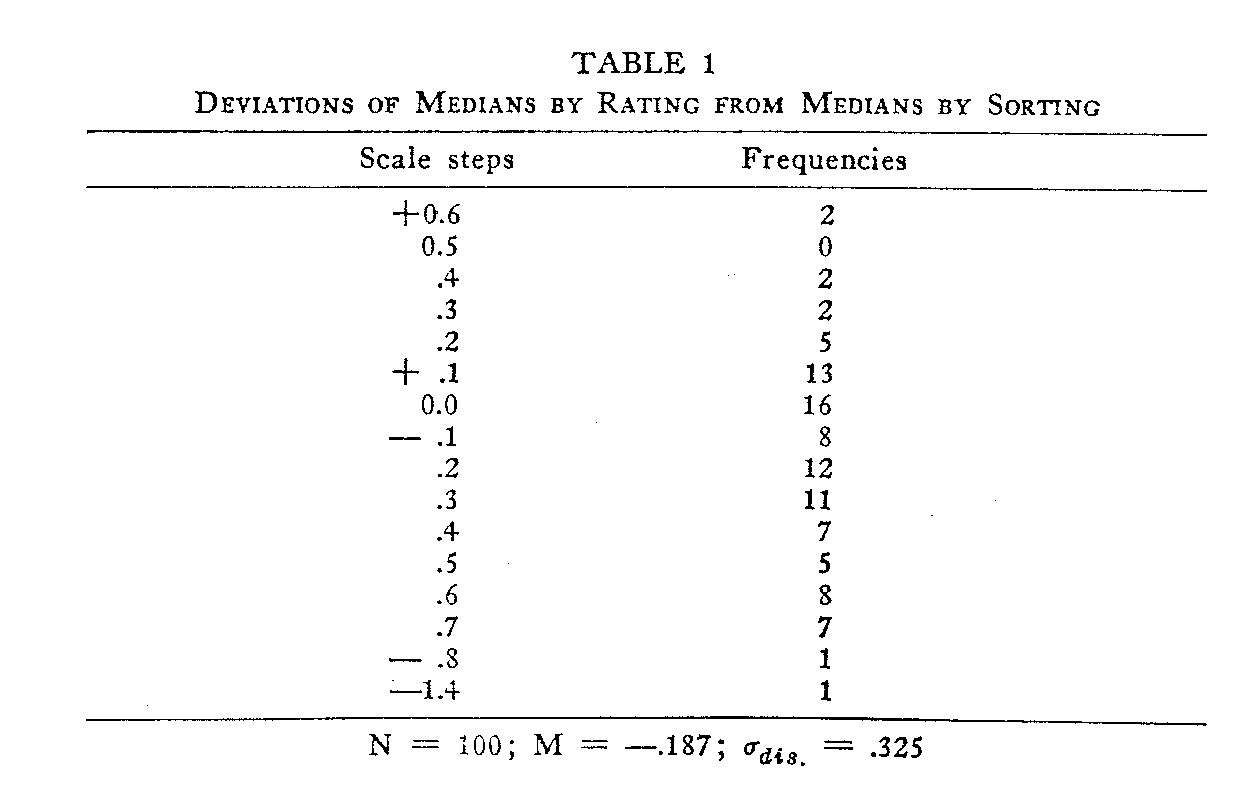
Table 1 shows the amount of deviation of the medians by rating, when the medians by sorting are taken as a standard. The mean of these deviations is -.187 with a sigma for the distribution of .325. In other words, there is a constant tendency for the medians by the rating method to fall
( 370)


( 371)

approximately 0.2 of a step below the medians by the sorting method, on a scale range of nine steps. This is probably not a significant difference.
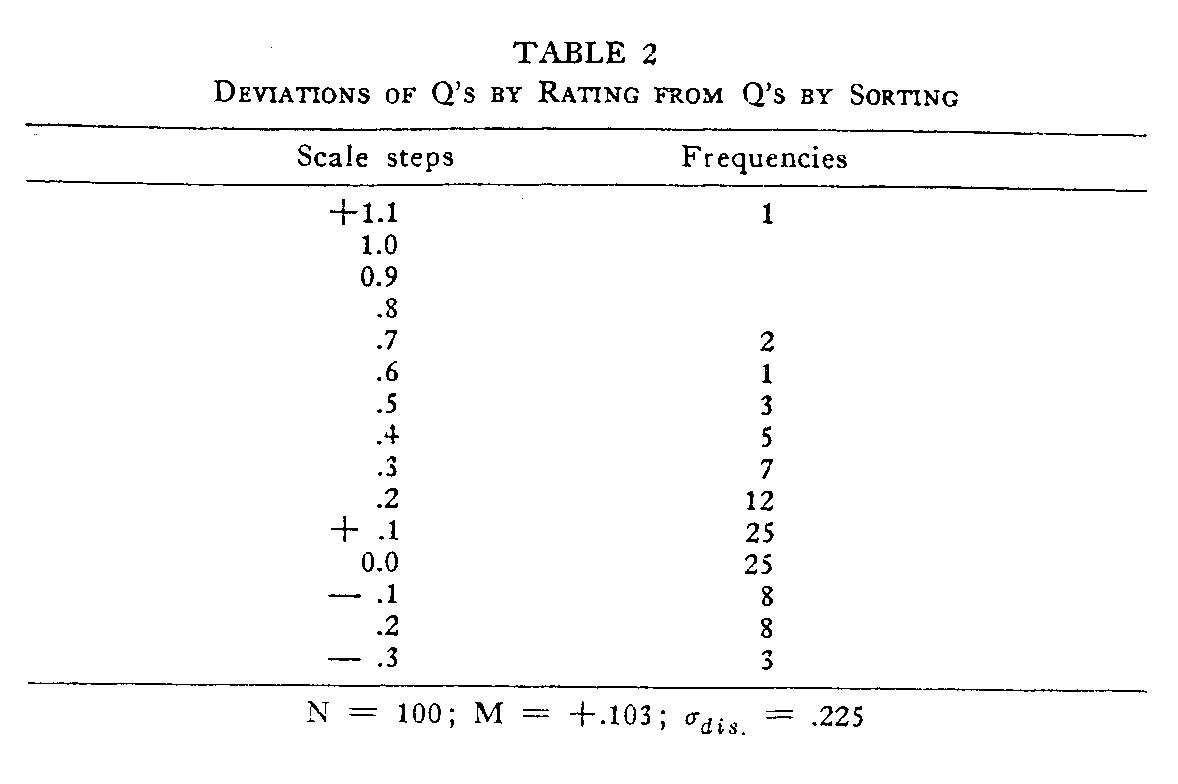
Table 2 gives the amounts of deviation of the Q values by rating from the Q values by sorting, and again the deviation is small. There is a tendency for the Q values for the rating method to be somewhat larger than those for the sorting method, since the mean of the deviations is -x-103.
Since the two methods yield data which are so nearly identical and since even a comparison of two groups using the same method would show some difference, the use of either one or the other would be determined on other grounds — efficiency or expediency, ease or pleasantness in administering them. The method of rating, in contrast with the sorting, has two apparent defects. (1) The statements cannot be arranged in random and different orders for each subject, but each statement is always read immediately after a certain other one, and it is conceivable that, in some cases, the juxtaposition of certain statements might lead to a constant error of misplacement. This defect can be partially obviated by arranging the nine pages in" as many different orders as possible. Some evidence that it is not the cause of the slight constant errors found for the rating method may be drawn from a study of the nine statements which appear at the tops of the nine different pages of printed material. These statements were not read following any one particular statement, and should therefore be free from this defect of suggestion. The mean deviation, however, for these nine statements was -.25 as compared with the -.187 of the 100 statements in the case of the medians, and +.089 as compared with + .103 for the Q values. (2) The second defect is in connection with the subject's activities in sort-
( 372) -ing the slips. He does not have his nine piles in plain sight before him, and he can neither rearrange nor reassure himself in his judgments by looking at the other statements on the piles. He can, however, go back over his ratings to check them.
Although there is no objective evidence to show that the subjects preferred
the rating method to the sorting method, there is some subjective evidence which
indicates that the subjects found the rating easier, faster, and more
convenient. Without exception, all those who were offered a choice asked to be
allowed to work by the rating method. The method is chiefly advantageous,
however, in saving the time of the experimenters. After the statements were
received from the mimeographers they had to be cut apart, into 100 piles
of 75 different statements each, and then enclosed, together with the cover
slips, paper clips, and folded page of directions, in a large envelope, a
process which occupied 12 hours of time. On the other hand, only hours were
necessary for the reassembling and stapling of the nine pages in readiness for
the 75 subjects by the rating method, a saving of 87%. Likewise, with the
tabulation of the results, the sortings required 15 hours, while the ratings,
which could be arranged in regular order, were recorded in 8 hours, a saving of
approximately 50%.
SUMMARY
A method of rating on a nine-point scale which is printed on the left-hand margin for each item has been substituted for the standard method of sorting items into nine piles, from separately printed slips. The rating method saves from 50% to 87% of time on the various processes involved in making attitude scales by Thurstone's method of equal-appearing intervals.
The subjects find the task easier and more pleasant, and the results, when
two groups of 75 subjects were compared, show negligible differences in the
medians, or scale values of the items, and in the difference or spread of
opinion (Q value) in regard to them.
REFERENCE
1. THURSTONE, L. L., & CHAVE, E. J. The measurement of attitude. Chicago: Univ. Chicago Press, 1929. Pp. 96.