An Empirical Study of Three Psychophysical Methods[1] [2]
Kate Hevner
Psychological Laboratories
of the University of
Chicago
THE PROBLEM
It was the object of this study to compare, on the basis of empirical data, some of the commonly used methods of constructing psychological scales. In order to make such a comparison, it would be necessary to construct the psychological scales from the same material, with the same subjects, and under conditions similar in every respect except the method by which the material was presented to the subject for judging. By such a procedure we can isolate any phenomena which are not inherent in the nature of the material, or in the criteria on which the individual judgments are made, but which are characteristic only of the method of making the judgments. We can learn whether the scale values resulting from the use of the various methods are comparable, and, if they are not, we may be able, by further analysis, to learn which series of values most nearly approximates the true values.
The three methods selected for study are methods which originated in the early psychophysical experiments on lengths of lines, intensities of gray values, lifted weights, etc., where the material could be measured both objectively and subjectively. These methods were later applied to material which could be measured by subjective methods only, and for which no adequate objective measure could be found.
Many such applications of the older psychophysical methods have been made by psychologists who are interested in converting a qualitative series into a series of quantitative differences. The work was begun in America by Cattell, who used the order of merit method for his ratings of scientific men (1). His methods and variations
( 192) of them were subsequently applied to other fields of subjective measurements. The method of equal appearing intervals was used by Thorndike (2) in order to calculate quantitative scale values for a series of subjective differences. Thorndike's methods have also been applied to other fields. These older methods differ from the methods used in this study in the number of items which are judged, in the number of individual judgments made for each item, and in the details of procedure, but more especially in the statistical treatment of the data. The law of comparative judgment, introduced by Thurstone in 1927 (3), has been used in the calculation of these scale values, rather than the older psychophysical processes which involve the use of the probable error as a unit of measurement. The value of this process in calculating scale values, for very complex stimuli which involve a great deal of personal prejudice and bias, has already been demonstrated (3). Its validity for calculating the scale values for the handwriting specimens used in this experiment is further justified by the internal consistency of these data. The average discrepancy between the calculated proportions of each judgment, and the corresponding experimental proportions, which serves as a measure of internal consistency, is less than .03.
The three methods chosen for study were the order of merit method, the method of paired comparison, and the method of equal appearing intervals. The process applied to the first two methods was that of the law of comparative judgment in its simplest form, Case V. A graphical process was used for calculating the scale values in the method of equal appearing intervals. All the details of these procedures are explained in the section on "The Experimental Procedure."
The material chosen for scaling was handwriting. A comparison could therefore be made of the methods when used on psychological values instead of on simple physical stimuli. Since a study of method only was intended, it might be argued that more simple and homogenous material should have been used, e.g., some material which would involve only one variable, such as length of line, intensity of gray value, extent of areas, etc. But the advantage of simplicity, with material of this sort, is offset by the disadvantages of presentation. Such material must be presented by the experimenter in the laboratory to each subject individually, and the amount of time involved would be prohibitive. Since the method was of primary interest, it was essential that there should be a large number of judg-
( 193) -ments on each stimulus, so that the stability of the results should be unquestionable. It seemed necessary, therefore, to prepare material which could be manipulated by the subjects outside the laboratory, and without the help or supervision of the experimenter. Handwriting specimens satisfied these conditions very well, and carried with them the added advantage that they could not be actually weighed or measured by unreliable subjects.
To the layman, the criteria for judging excellence in handwriting are almost entirely subjective. Personal preferences and abilities are involved, as well as the legibility and the pleasing appearance of the writing. Such complexity is typical of most of the variables to which these methods of measuring are being applied at the present time, for example, English composition, specimens of sewing, and other handiwork, nationality and race preferences, and attitudes of various kinds. That the distribution of opinion and preference in regard to these variables follows the normal curve, must be proved in each individual case by the internal consistency of the data, and in this case, with excellence in handwriting as the variable, the proof seems clear.
After some preliminary experimentation, it was decided to define the
handwriting variable more closely by asking the subjects to base their judgments
on three criteria—neatness, uniformity of the slant, and uniformity of the stems
and ovals of the letters. These three criteria were suggested twice in the
instructions to the subjects, and there was also a warning to avoid such factors
as the "character" which the writing showed, and the particular personal
associations which might be called out by certain specimens.
THE EXPERIMENTAL PROCEDURE
Three hundred and twenty individuals were asked to write the phrase "A very good explanation" in their ordinary handwriting on the penciled line of a 4 x 6 card. Those individuals were chosen whose handwriting would give as wide a range as possible in degree of excellence. They included university students, high school and grade school pupils, unskilled laborers, bookkeepers, and handwriting experts. Ten adult subjects then sorted these 320 samples into seven piles, placing all the worst specimens on the pile at the extreme right, all the best specimens on the pile at the extreme left, all the aver-age specimens on the pile in the middle, and arranging the other four piles so that all seven should form a graded series of excellence
( 194) in handwriting. The instructions to the judges in this preliminary experiment were merely: "Judge each specimen by whatever makes it seem good or bad handwriting to you." The judges were allowed to sort and resort as much as they wished, until they were entirely satisfied with their judgments. They consumed on the average an hour and a half in completing their work for this preliminary experiment.
From the results of these experiments, the average position among the piles was reckoned for each of the 320 specimens, and the specimens arranged in rank order on the basis of these averages. Then, beginning with the best specimens and working through the whole series to the worst specimens, approximately every fourth card was selected in order to secure the final series of 72 specimens which was used in the method of equal appearing intervals. Since it was planned to make a scale of slant writing only, the specimens which inclined more to the vertical were avoided. Certain specimens in which the quality of the ink was not well adapted to the zincographing process were also discarded. From this series of 72, again approximately every fourth specimen was selected in order to se-cure another graded series of 20 specimens for the order of merit method. Code numbers were assigned to the 72 specimens, and they were reproduced by a zincographing process on slips of white paper, 1% x 4 inches. The zincographing process reduced the original size of the handwriting very slightly, but otherwise provided a faithful reproduction.
The 20 specimens used in the order of merit method were also used in the method of paired comparison. The code numbers were cut off, and the 190 necessary pairs of specimens were arranged in two parallel columns, on 81/2 x 11-inch pages. Each pair of specimens was set off by heavy black lines in order to reduce the error from side comparisons. The 12 pages containing these specimens were stitched together in the upper left hand corner, and a rotating order was used with them so that the effect of fatigue would not always come on the same pages.
All the material for the experiment was included in a heavy manila envelope, 9 x 12 inches, which could be placed in the subject's hands without further instruction or supervision from the experimenter. The material included (a) the 12 pages of specimens for the method of paired comparison ; (b) an 8 ½ x 4-inch envelope containing the paper clips, the covering slips labelled a, b, c, d ... .
( 195) k, and the 72 specimens for the order of merit method, and (c) the printed page of instructions. The instructions read as follows:
This envelope contains a number of specimens of adult slant writing from which a scale of handwriting is to be constructed. The scale will be made by three different psychophysical methods. In each of the methods you will be asked to compare the different samples and judge the quality of the writing. By "quality" we mean "good appearance," that is, neatness, uniformity of the slant, and uniformity of the stems and ovals of the letters. Base your judgments on these factors, and be careful to eliminate such factors as the "character" which the writing shows, or the particular associations, pleasant or unpleasant, which you may have with certain specimens. The scale is to be made on the basis of:
1) Neatness.
2) Uniformity of the slant.
3) Uniformity of the stems and ovals of the letters.
Method 1
1) You are given eleven slips with letters on them, A, B, C, D, E, F, G, H, I, J, K. Please arrange these before you in regular order. On slip A put those specimens which you judge to be the best specimens. On slip F put those specimens which you judge to be the average specimens. On slip K put those specimens which you judge to be the worst specimens. On the rest of the slips, arrange the specimens in accordance with the degree of excellence you find in them.
2) This means that when you are through sorting you will have eleven piles arranged in order from A, the best, to K, the worst.
3) Do not try to get the same number on each pile. They are not evenly distributed.
4) The numbers on the slips are code numbers, and have nothing to do with the sorting.
5) You will find it easier to sort them if you look over a number of specimens chosen at random before you begin to sort.
6) It will probably take you about 20 minutes to sort them.
7) When you are through sorting, please clip the piles together, each with
its letter slip on top. Replace the 11 piles, clipped carefully, in the envelope
marked "Method 1," and seal.
Method 2
In this method, spread out the 20 samples before you and arrange them in sequence according to their merit. Select the best specimen and place it at the extreme left; then find the second best specimen and place it beside the first, and the third best and place it beside the second, and so on down to the worst specimen, which will appear at the extreme right. When the whole sequence is laid out before you, you may wish to make some revisions. When you have finished, gather the specimens together in one pile, with the best one on top and the worst one on the bottom. Place the
( 196) rubber band around the whole pile and seal them in envelope marked "Method 2."
Method 3
Use the 12 pages of specimens and follow directions given at the top of the first page.
The subject arranged the specimens according to the instructions, fastened the piles securely with paper clips and rubber bands, and sealed them in the proper envelopes. Approximately one hour was spent by each subject in performing this part of the experiment.
The experiment was performed by graduate and undergraduate students in the University of Chicago, and by undergraduate students in Wilson College, Chambersburg, Pennsylvania, in Colgate University, Hamilton, New York, and in the State College for Teachers, Superior, Wisconsin. Omissions and mistakes made it necessary to eliminate the work of some of these subjects, but the experiment was completely and correctly performed by 370 subjects.[3]
THE STATISTICAL TREATMENT OF THE RESULTS
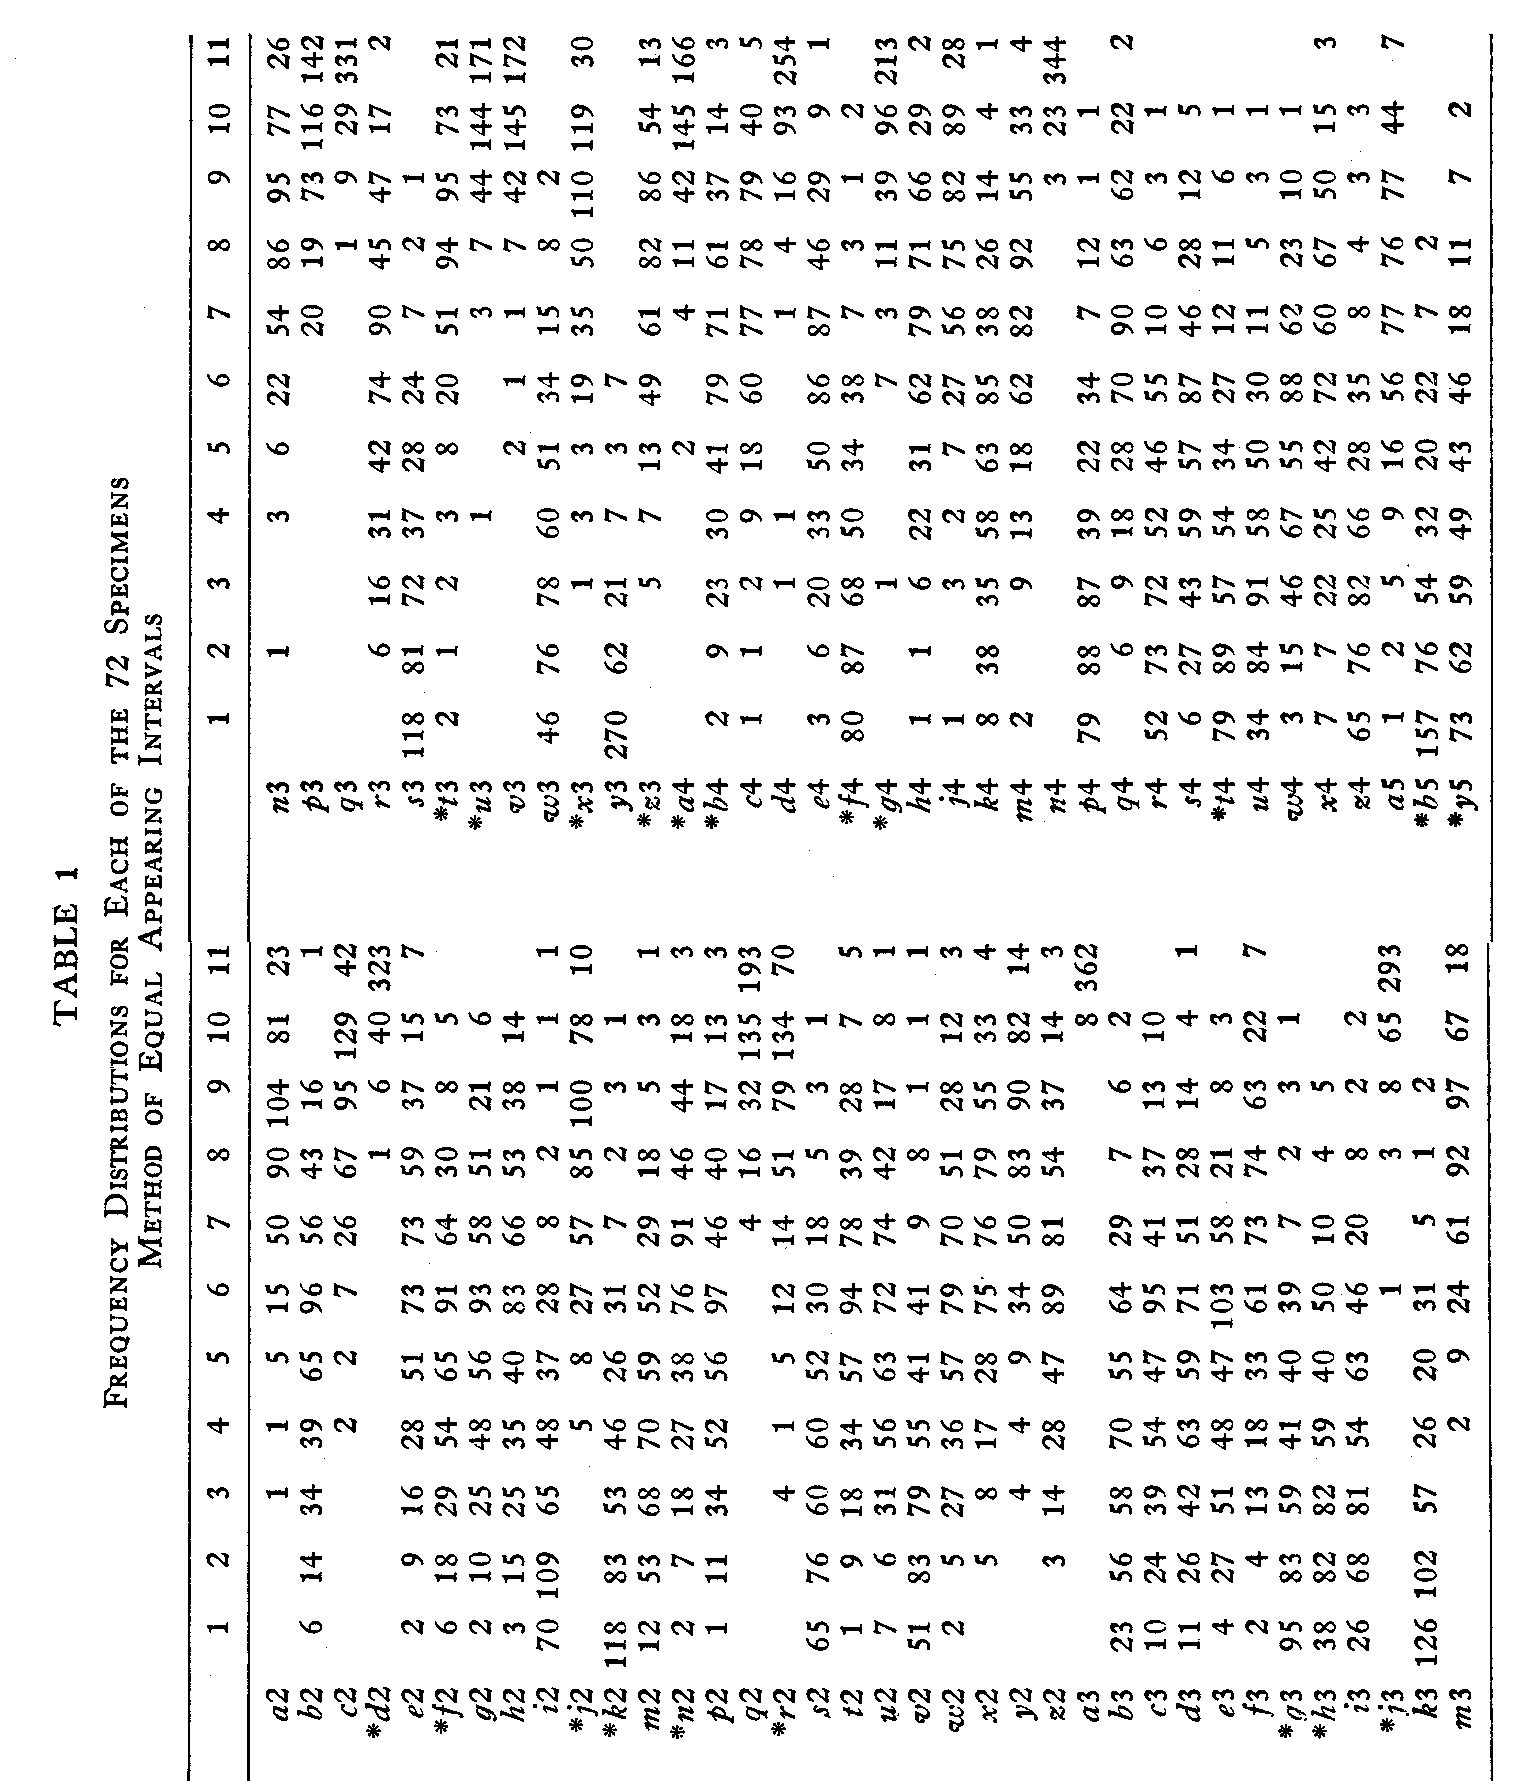
The results for the method of equal appearing intervals are given in Table 1. This table shows the number of times each specimen appeared in each of the 11 piles. Records are included for each of the 72 specimens, although in this study scale values have been calculated only for those specimens which are also included in the order of merit method and the paired comparison method. In Table 1, these 20 specimens are marked with an asterisk.
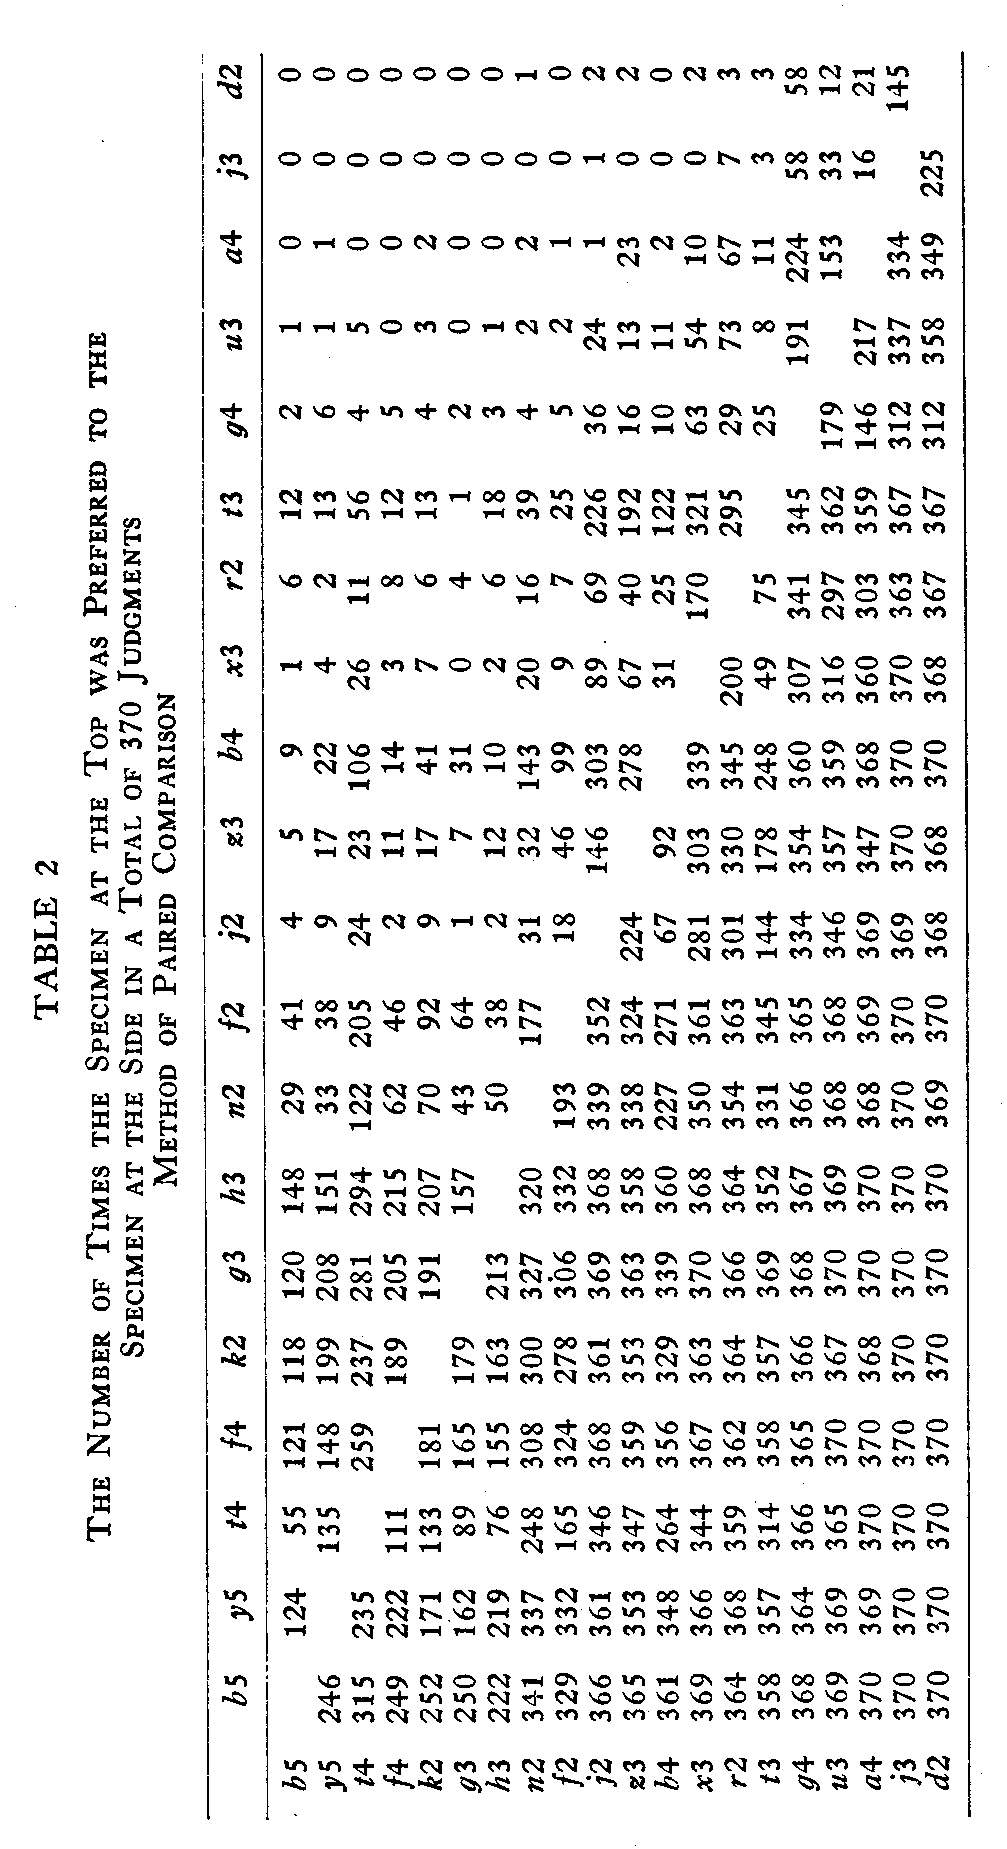
The results for the method of paired comparison could be tabulated directly from the 12 pages of specimens, and these results are recorded in Table 2.
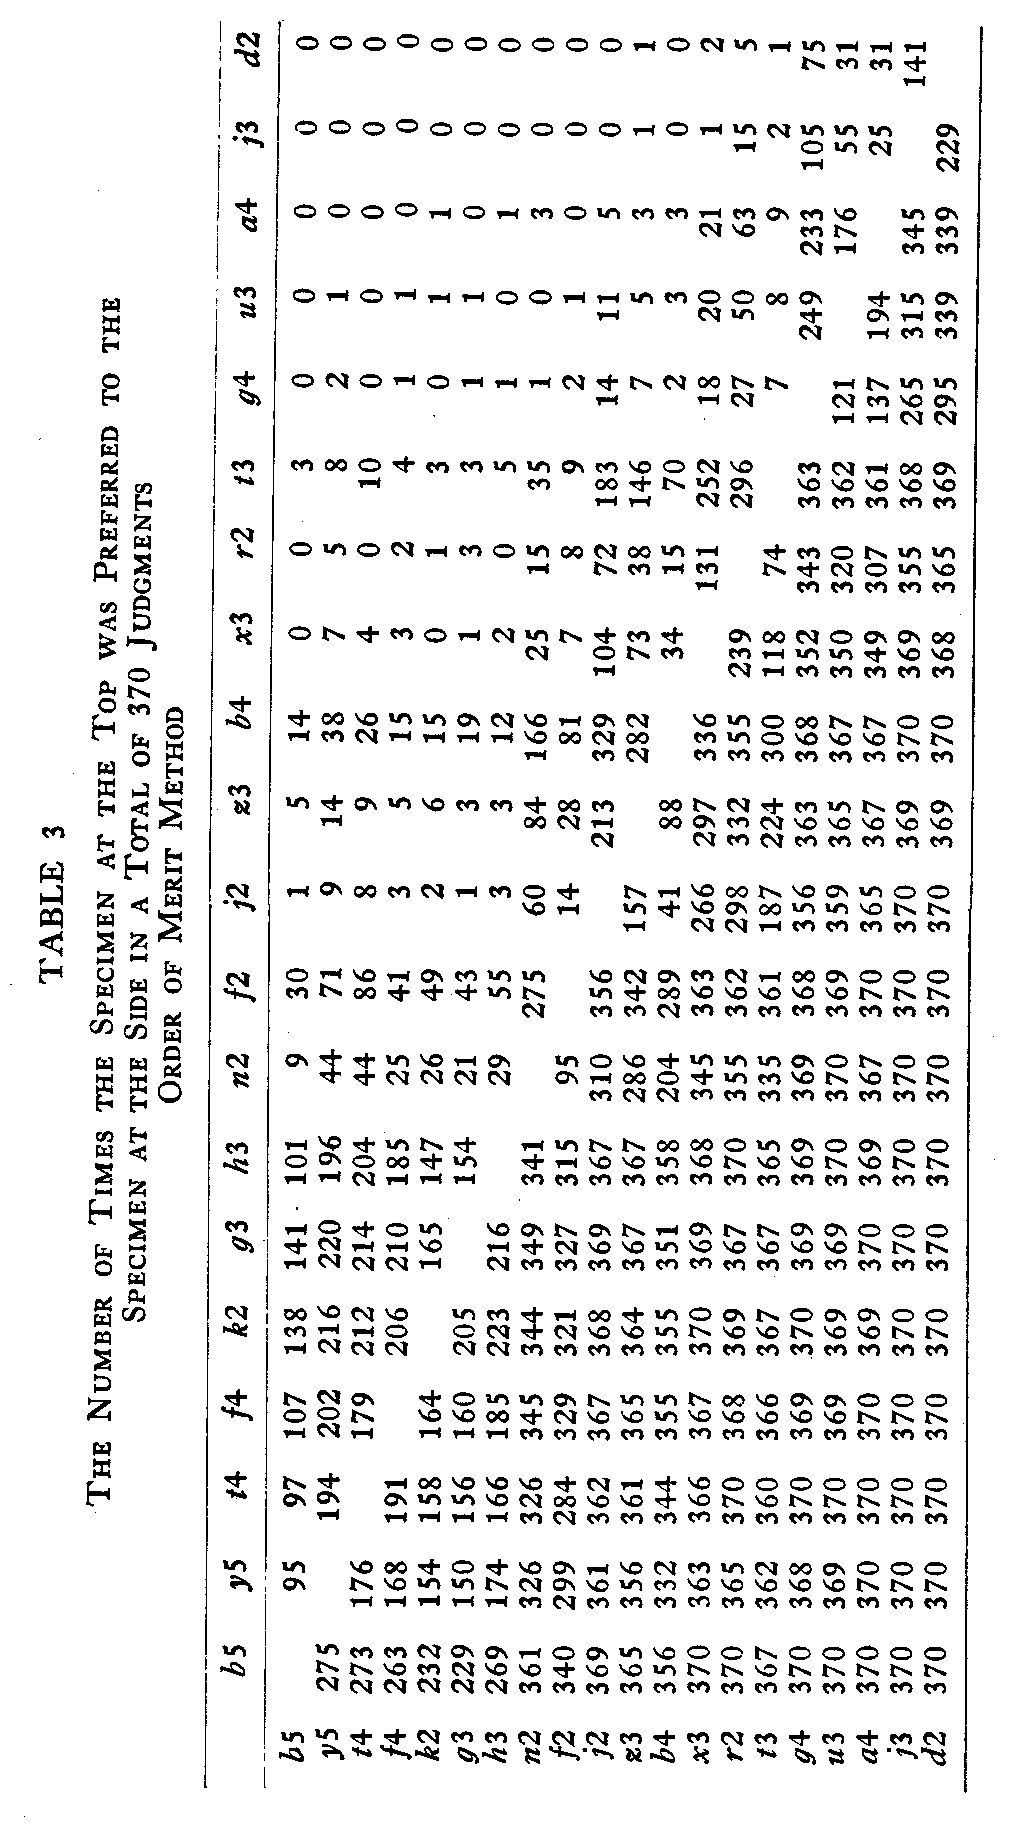
Table 3 shows a similar set of data for the order of merit method, although this tabulation could not be made directly from the subject's records, as in the case of the paired comparison method. The rank order of the specimens for each subject was first recorded, and especially prepared data sheets were then used to tabulate for each subject the number of times each specimen was preferred to every
( 197)
( 198)
( 199)
( 200)
other specimen. The results of this method, in their final form are, therefore, comparable to the results of the method of paired comparison, and the statistical treatment of the results was the same for both methods.
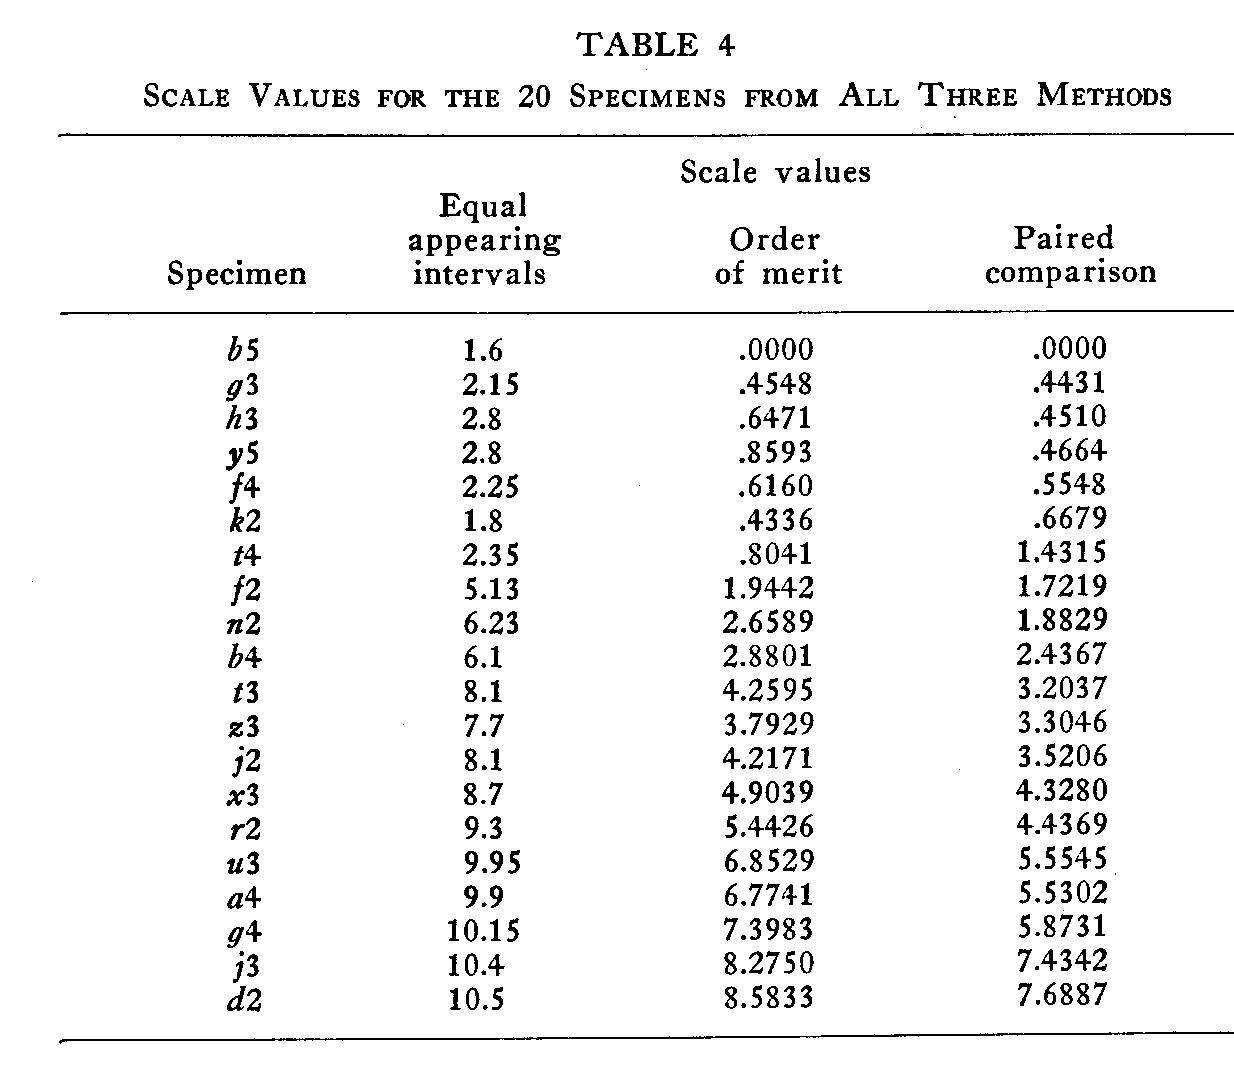
The next step in the study was the calculation of a scale value for each specimen, in each method. In the method of equal appearing intervals the calculation of the scale value was a comparatively simple procedure. From the frequency distribution for each specimen, a cumulative frequency curve was plotted, and the median, the point at which the curve crossed the 50% line, was read directly from the graph. The medians for each of the 20 specimens are given in Table 4.
Since the psychophysical law of comparative judgment can be applied to any situation in which a number of observers make one discriminatory judgment for each possible pair of stimuli in any given stimulus series, this law was applied to the data from both the paired comparison and the order of merit methods. It would
(201) be assumed under this law that the distribution of preference in handwriting is normal on the psychological continuum, and this assumption may be questioned. However, there is already some evidence that the assumption of a normal distribution is justified in the case of a very complex continuum such as nationality preferences (4), as well as for the simple sense distances of the more formal psychophysical experiments; and the assumption, in the case of hand-writing excellence, is undoubtedly a safe one, since there is an aver-age discrepancy of less than .03, when the calculated proportion of each judgment is compared with the corresponding experimental proportion.
The law in complete form is as follows (4, p. 407) :
Sl—S2=X12√σ12 + σ22 – 2r12.σ1.σ2
in which
Sl—S2=the scale distance between the two modal discriminal processes
X12= the sigma value corresponding to the observed proportion of judgments, "Stimulus1 is greater than Stimulus2."The proportion is designated p1>2. The numerical value of X12 is positive when p1>2 is greater than .50, and it is negative when p1>2 is less than .50.
σ1 and σ2=ambiguities (discriminal errors) of the two stimuli.
r12=the correlation between the discriminal deviations involved in the same judgment.
In this study we have used Case V in which the law is applied to a group of subjects, and each subject gives only one judgment for every stimulus pair. In Case V it is assumed that r12=0, and that the value of σ is unity for every stimulus in the series. With these approximations, the law takes the simpler form :
Sl—S2=X12√2, (2)
when σ is chosen as the unit of measurement.
From Table 2 which gives the data for the method of paired comparison, a corresponding table of proportions was made, and from this table, the percentage of judges who preferred each specimen to every other specimen could be read directly. The tentative rank order for each specimen could also be easily calculated from this table by summing the percentages for each of the specimens in turn.
The next step was to prepare a table of sigma values corresponding to the percentages. Since a procedure of weighting all the
( 202) proportions in such a calculation as this would be extremely laborious, the most unreliable proportions were not used in calculating the scale values. Those which were dropped were proportions of .97 or above and of .03 or below. Those proportions which were retained were all given equal weight. When the measures of internal consistency were calculated, it was apparent that these approximations were not unwarranted.
From this table of sigma values the scale separation for every consecutive pair of specimens was calculated. Theoretically it would be possible to calculate the scale separation for any pair of specimens in the table, no matter how far apart they might be on the scale, but actually such a procedure would not be practical. When two specimens are widely separated on the scale, many of the proportions are included between zero and .03 and between .97 and 1.00, and are dropped out of the calculations. The scale separation would be calculated from the few remaining pairs of sigma values, and therefore could not be considered satisfactory. For this reason, the scale separations have been calculated only for those specimens which were adjacent in rank order.
It was necessary to prepare a separate table for the calculation of each of the scale separations. The data for these tables was obtained from the table of sigma values, and with these 19 tables the procedure in general was as follows :
Let us suppose that the two specimens for which we are to calculate the separation are the 11th and 12th specimens when arranged in rank order. They will be designated then in general terms by S11k and S12k, respectively. If any of the other specimens be designated by Sk, then from equation (2) page 201 we have
S11k – Sk = X11k√2 (3)
and
S12k – Sk = X12k√2 (4)
where X11k√2 represents the distance on the scale between specimen S11k and the other given specimen Sk, and X12k√2 represents the distance on the scale between S12k and the given specimen.
Subtracting (4) from (3) we have
S11k – S12k=√2(X11k-X12k) (5)
In other words, √ 2(X11k-X12k) is the scale separation of S11k and S12k when calculated in terms of but one of the 20 specimens.
( 203)
Summing such values for all the specimens, we have, in general terms,
n(S11k – S12k)=√2Σ[X11k-X12k] (6)
or
(S11k – S12k)= (√2 / n) [ΣX11k-ΣX12k] (7)
that is, the actual scale separation for any two specimens is equal to the sum of the scale separations for those two in terms of all the other specimens, divided by the total number of such calculated scale separations.
By means of these 19 calculated scale separations the handwriting scale was constructed. Specimen b5, which was preferred more often than any other specimen was arbitrarily chosen as the origin for the handwriting scale, and the scale values of all the other specimens were procured by successive additions of the scale separations. Since all the other specimens were preferred less often than b5, and are therefore lower in a scale of handwriting excellence, a numerically high scale value indicates poor handwriting. The scale values for the 20 specimens by the method of paired comparison are given in Table 4, and they run from .00 to 7.69. The better specimens have the lower numerical values.
After the scale values have been ascertained, it is necessary to apply a test Mr the internal consistency of the data. This can be done by using the scale values of the specimens as starting points, and by reversing the whole process, and finally arriving at a set of calculated proportions which may be compared with the experimental proportions. Since we now know the scale values, we can calculate the value of the X12 in the equation
S1 – S2 = X12 √2
and with the use of the probability table, this value may be converted into the corresponding proportion. The degree of similarity between such calculated proportions and the actual experimental pro-portions will give a measure of the internal consistency of the data.
Twenty tables (one for each specimen) were made in order to calculate this consistency. The average discrepancy between the calculated and the experimental proportions ranged from .038 to .00015, and the average discrepancy for the whole table was .0239.
The procedure for calculating the scale separations and final scale values for the specimens in the order of merit method was exactly the same in every respect as the procedure in the case of the method
( 204)
of paired comparison. The scale values are given in Table 4, and the average discrepancy between the calculated and the experimental proportions was .012.
COMPARISON OF THE RESULTS
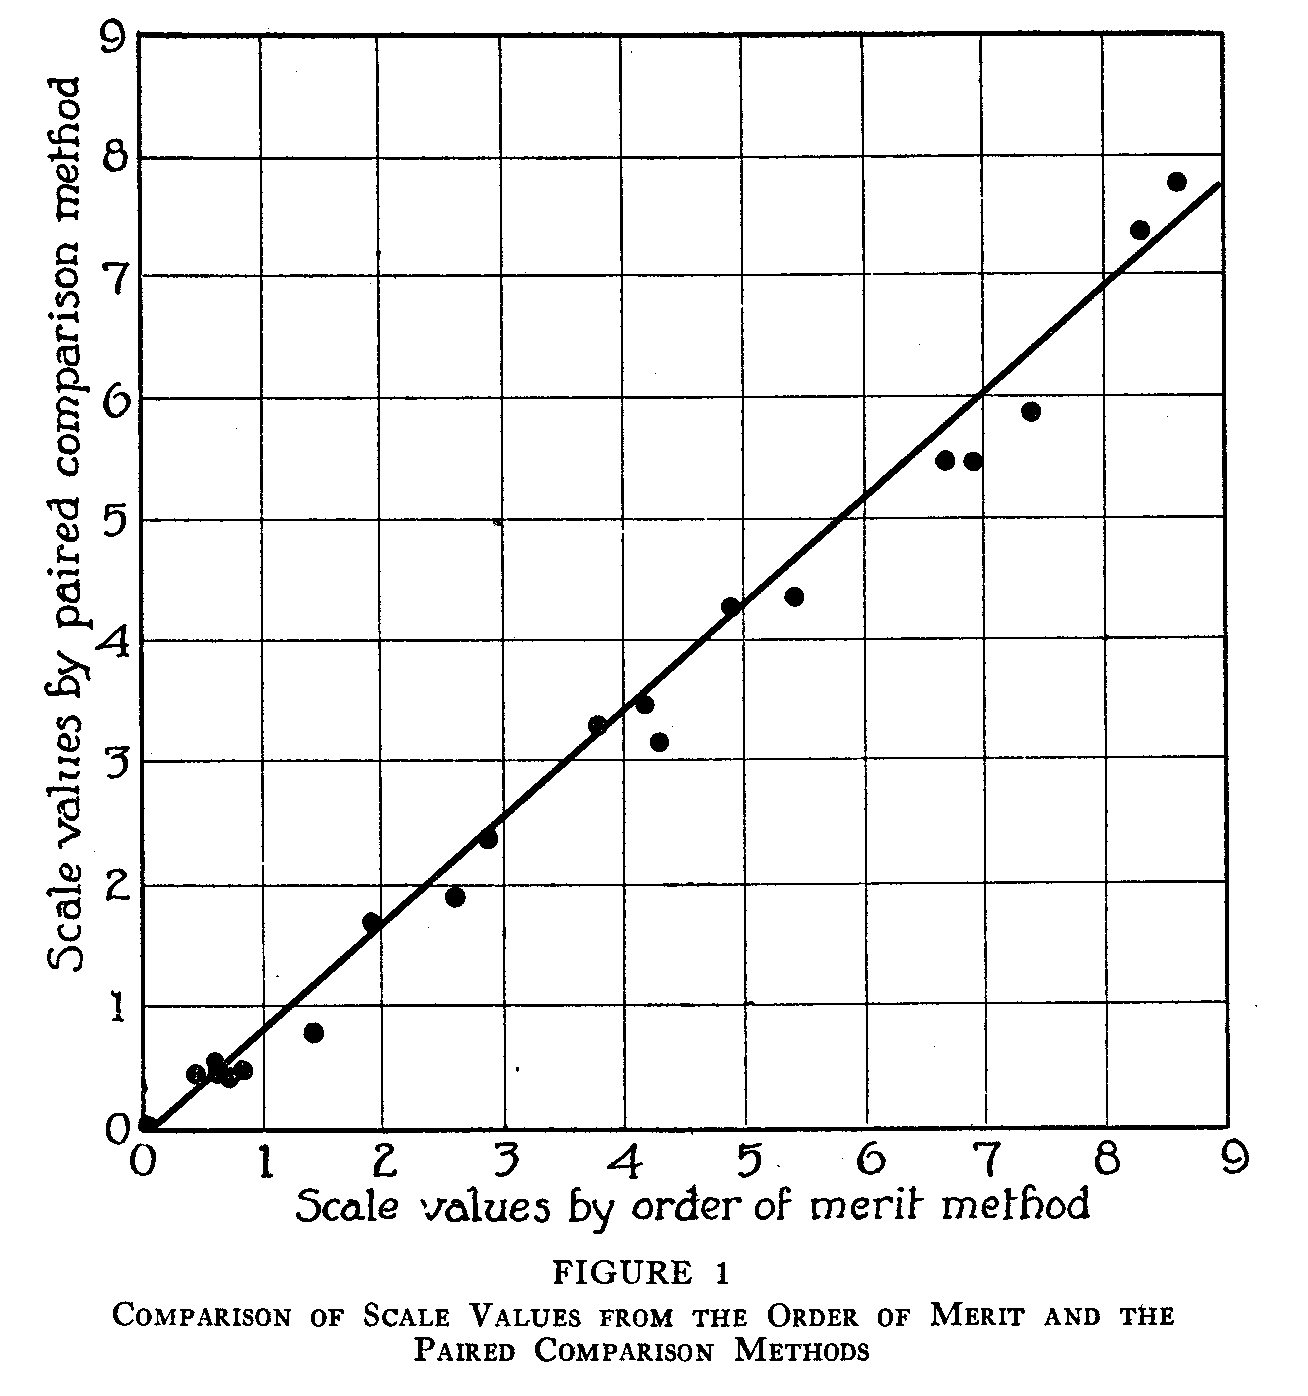
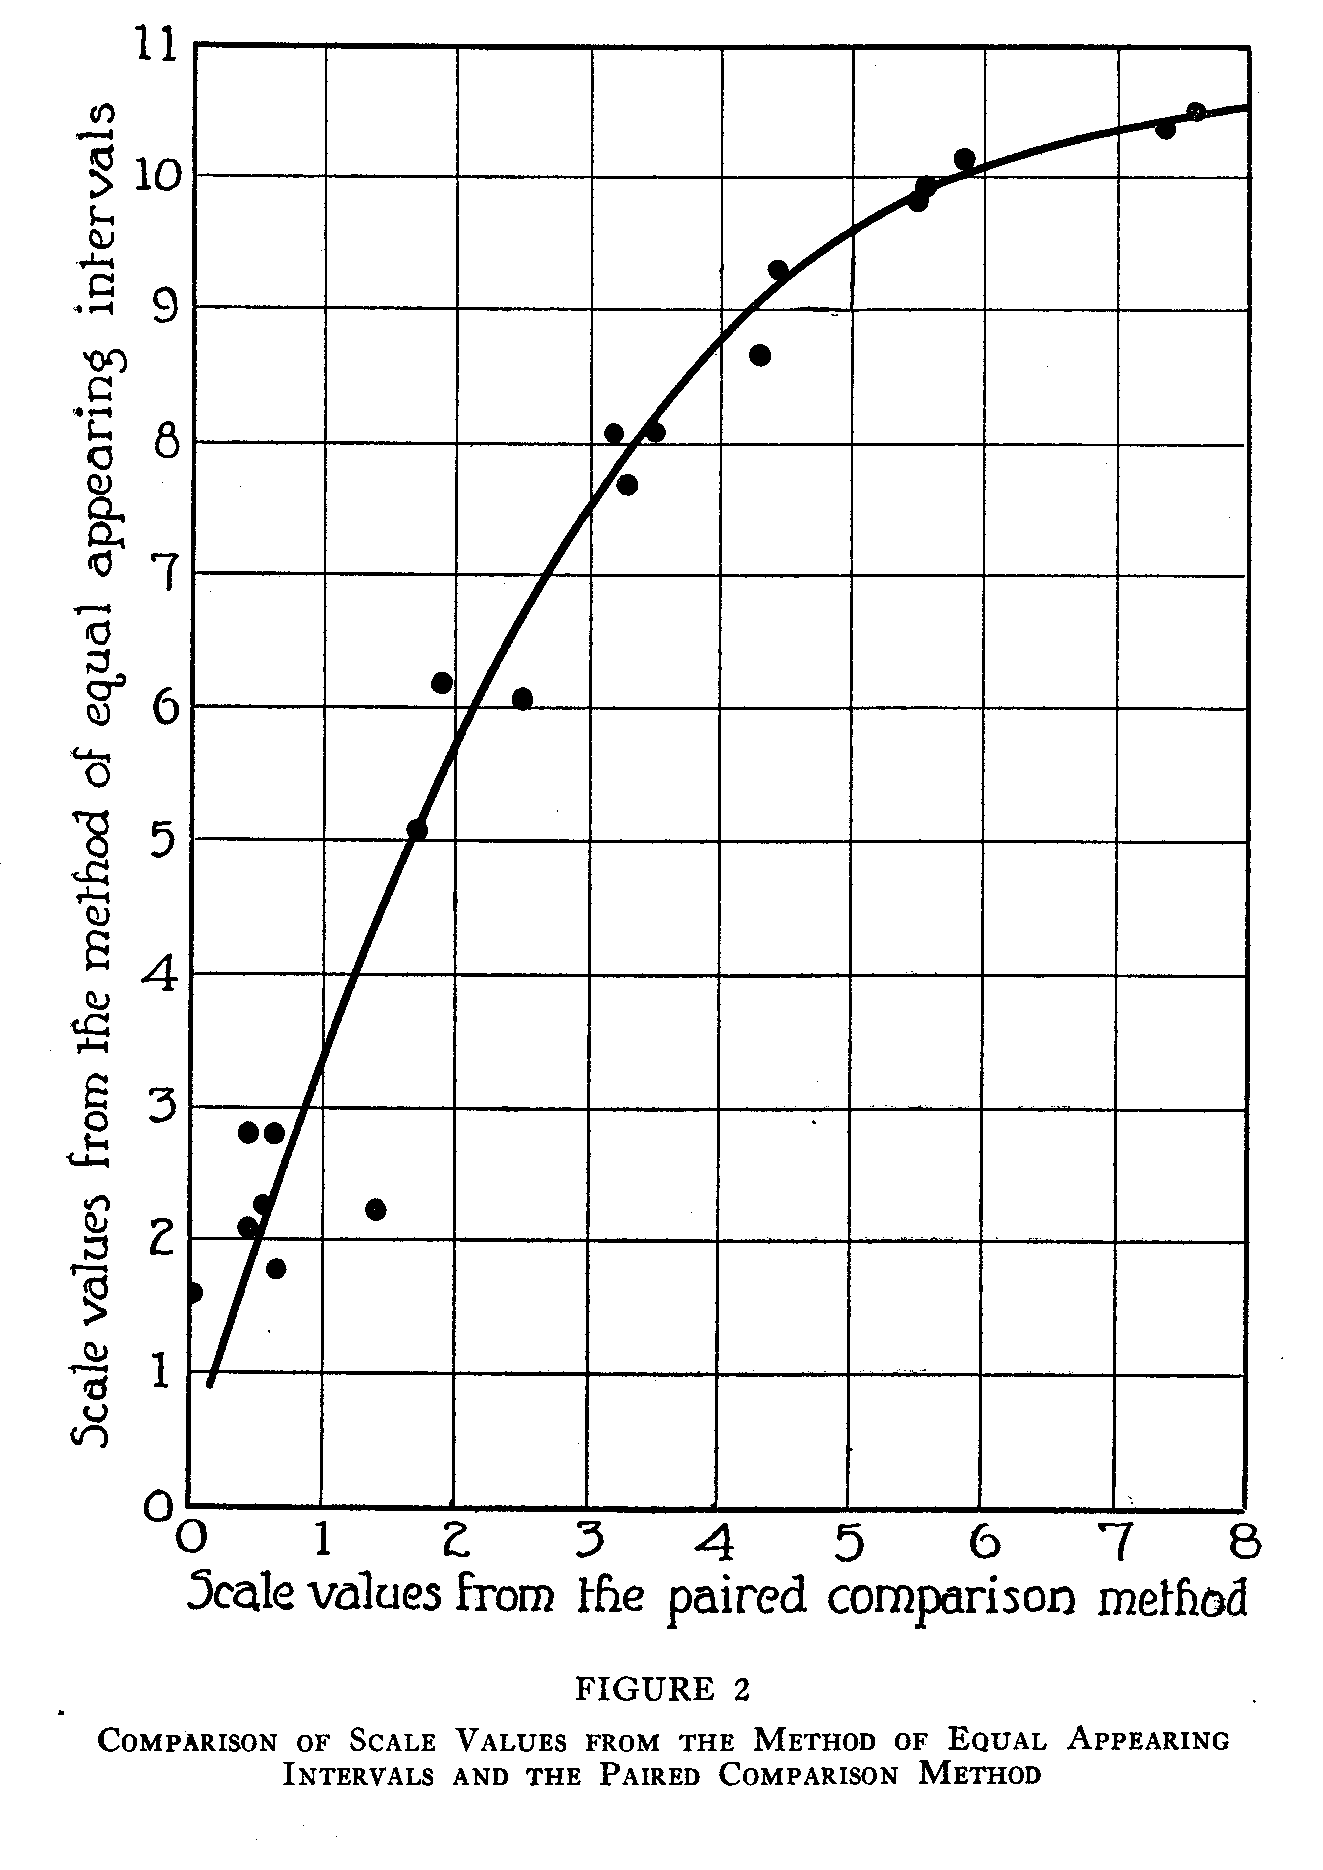
When the scale values for all the specimens have been calculated for each method, the methods can be compared by plotting the scale values for one method against the values obtained from each of the other two. This has been done in Figures 1, 2, and 3. The data from which these figures have been made may be found in
(205)
( 206)
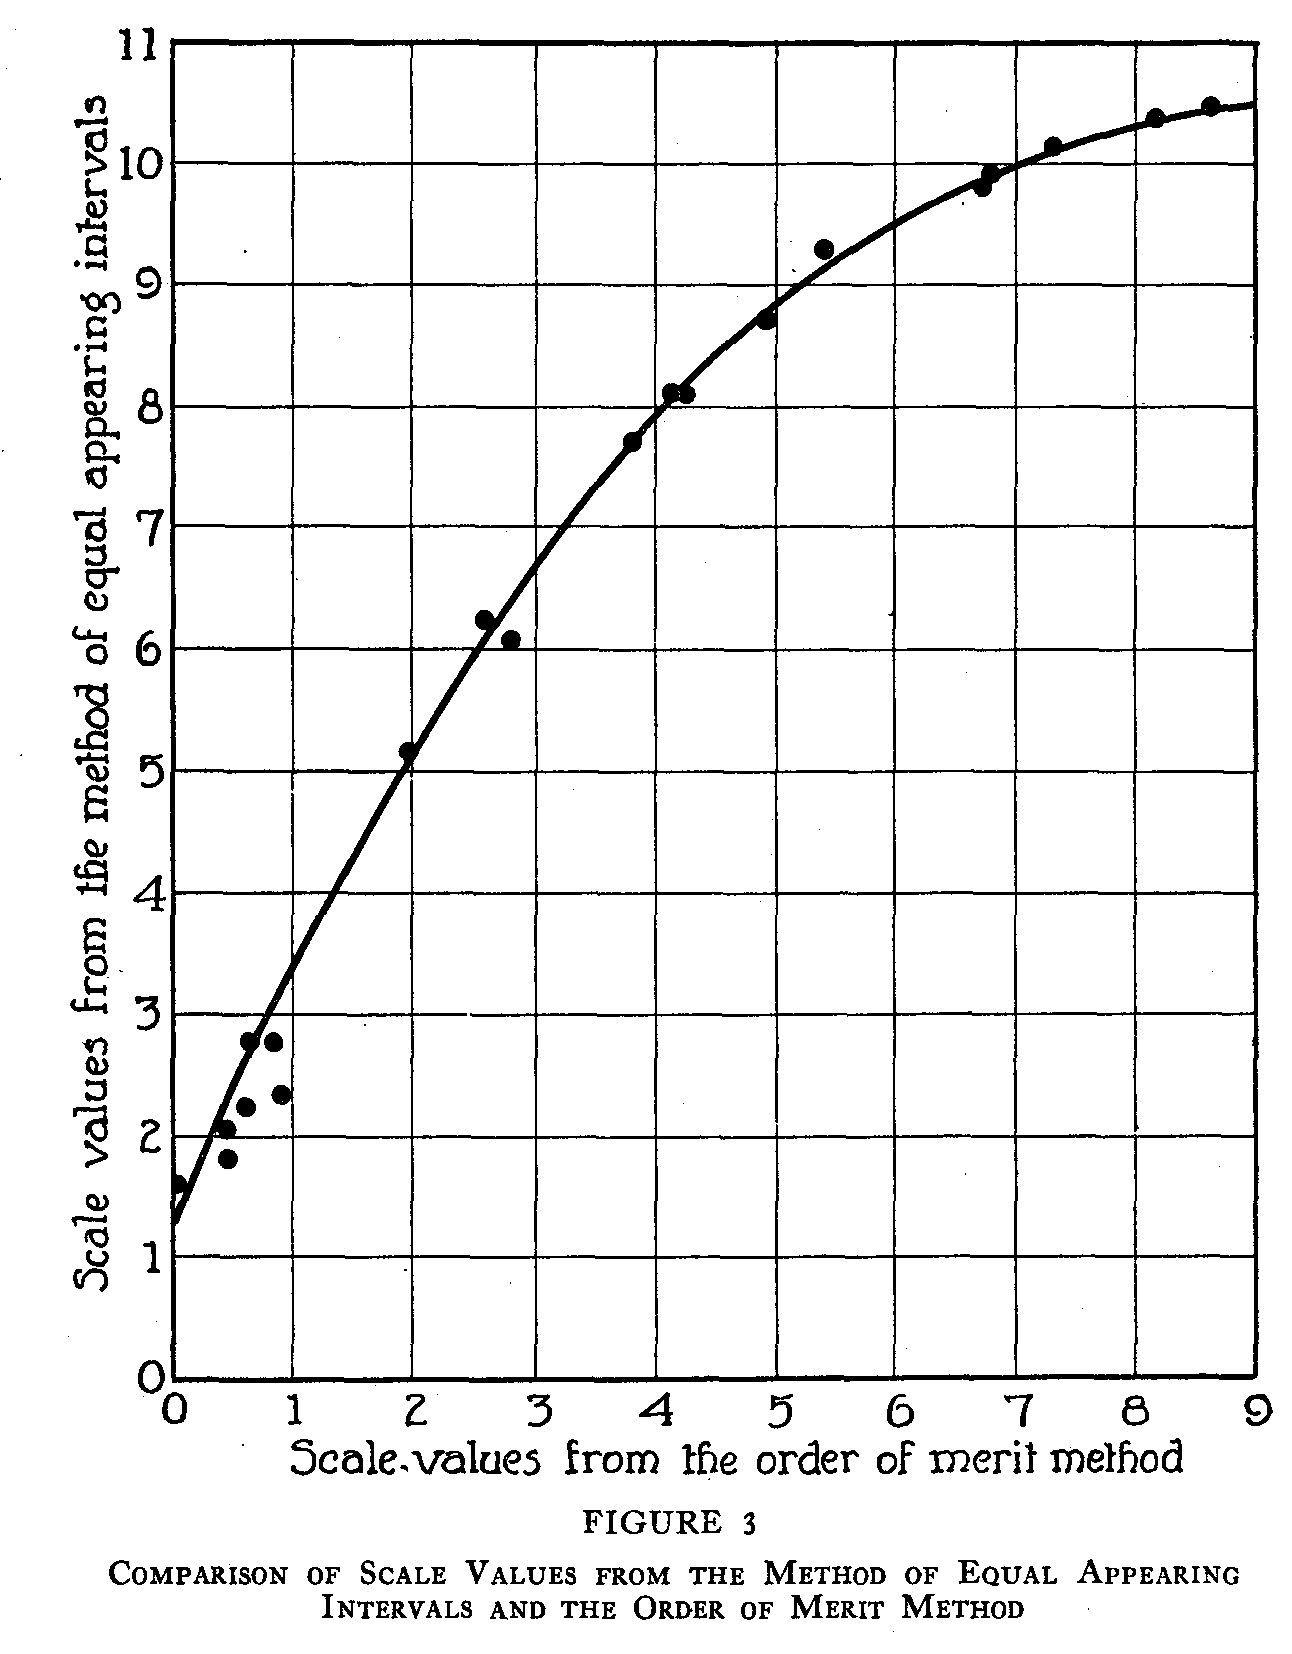
Table 4. In Figure 1, which represents a comparison of the method of paired comparison and the order of merit method, it is apparent that the relation between the two sets of scale values is a linear one. If it be assumed that the correlation between these two sets of data is unity, their regression line will take the form of
( 207)
y = (y/x) – (y/x)Mx —My
and substituting the actual values of the means and the sigmas, the equation for the line in Figure 1 will be
y= 1.18x—.009
An inspection shows that this line fits these data very well.
From the practical point of view it is valuable to know that the two methods yield the same results. The "set up" for an experiment with the method of paired comparison is much more elaborate and costly, the method takes more of the subject's time, and with certain kinds of material is almost impossible to apply. The order of merit method is much simpler, requires less material and less of the subject's time, but the collection of the data in order to apply the law of comparative judgment is a very laborious process for the experimenter.
An inspection of Figures 2 and 3 shows that the relation between the method of equal appearing intervals and each of the other two methods is not linear. In each of these figures the best fitting line has been approximated by inspection, and the relation is clearly curvilinear. The similarity of these two curves confirms the results illustrated in Figure 1. The handwriting scale derived from either the order of merit method or the method of paired comparison would be practically the same scale, but a scale derived from the method of equal appearing intervals would be quite different.
In considering the question as to which of these scales is the most reliable and valid, there are several factors which point to the superiority of the method of paired comparison and the order of merit method over the method of equal appearing intervals.
1) The method of paired comparison and the order of merit method give approximately the same scale values, that is, the relationship between them is linear.
2) The scale values from the method of equal appearing intervals are different from those of either of the other two methods. The relationship in each case is curvilinear.
3) In the method of paired comparison and the order of merit method the internal consistency of the data has been clearly demonstrated. In the method of equal appearing. intervals no test for such consistency has been applied and the absence of such a test must, for the present, be counted as the most important argument against it
(208)
4) In the method of equal appearing intervals the frequency distributions for those specimens at the extremes of the scale are not normal distributions (see Table 1).They suffer from an "end effect" which produces a skewed curve. This effect cannot be avoided since it is in the nature of the method that the scale must be arbitrarily cut off at either end, but it may be possible to devise a statistical treatment which would correct for it. Then the corrected medians for these skewed distributions would be as representative of the quality of the handwriting at the extremes of the scale as are the medians for those specimens near the center of the scale, where the range is not arbitrarily restricted.
5) The "just noticeable difference" or the discriminal error which is the fundamental psychophysical unit of measurement is incorporated in both the order of merit method and the method of paired comparison but it is not involved in the calculation of the scale values in the method of equal appearing intervals. This constitutes a very important difference, and it is surprising in view of it that the methods agree as well as they do.
It should be possible to work out a psychophysical process which would take
into account the discriminal error for each specimen in calculating its scale
value in the method of equal appearing intervals as well as in the other two.
The invention of such a process, together with a test for internal consistency
is undoubtedly the next step in the analysis of this problem. The assumption
under Case V of the law of comparative judgment, that the sigma values
for all the specimens are equal, is another point of departure for further
analysis, and until these studies are completed the final decision on the
validity and reliability of these methods cannot be pronounced.
SUMMARY
The object of this study was to compare the scale values of 20 specimens of handwriting, from data obtained by the paired comparison method, the order of merit method, and the method of equal appearing intervals. The judgments of handwriting excellence were obtained for all three methods from the same 370 subjects.
The scale values for the method of equal appearing intervals were calculated by plotting the cumulative frequency curve from the data for each specimen and reading the value of the median directly from the graph. These scale values are given in Table 4.
( 209)
The scale values in the method of paired comparison and in the order of merit method were obtained by applying the law of comparative judgment in its simplest form, Case V. These scale values are given in Table 4. The internal consistency of these calculations is shown by the very small discrepancies between the experimental and the calculated proportions. The average discrepancy is .0239 for the paired comparison method and .012 for the order of merit method.
The results show that the scale of excellence in handwriting would be the same whether the data were obtained by the method of paired comparison or by the order of merit method. The relation between the scale values as calculated by these two methods is linear (see Figure 1).
The relationship between the scale values calculated by the method of equal appearing intervals and either of these other two methods is curvilinear and the handwriting scale constructed by the method of equal appearing intervals differs from the scale constructed by either of the other two methods.
In their present state of development and from the point of view of validity and reliability, the scales constructed by either the order of merit method or the method of paired comparison seem to be superior to the scale constructed by the method of equal appearing intervals, because of the following facts:
1) The relationship between the scale values from the two former methods is linear.
2) The relationship between the values from the method of equal appearing intervals and the values from either of the other two methods is curvilinear.
3) The internal consistency has not been demonstrated for the method of equal appearing intervals.
4) There is a source of error in this method from the "end effect."
5) The psychophysical unit, the j.n.d., is not involved in the calculations for the scale values in this method.
As a method of collecting data from which psychological scales are to be
constructed, the method of equal appearing intervals can-not at present be
evaluated. A process must first be invented which will take account of the
j.n.d. in calculating scale values so that these values may be comparable to the
values from the other two methods, and a test for internal consistency must be
devised.
REFERENCES
1. HOLLINGWORTH, H. L. Professor Cattell's studies by the method of relative position. Columbia Univ. Contrib. Phil & Psychol., 22, No. 30.
2. THORNDIKE, E. L. Handwriting. Teach. Coll. Rec., 1910, 11., 1-81.
3. THURSTONE, L. L. A law of comparative judgment. Psychol. Rev., 1927, 34, 273-286.
4. ———, An experimental study of nationality preferences. J. Gen. Psychol., 1928, 1, 405-425.
University of Minnesota
Minneapolis, Minnesota