Moral Valuations About Men and Women
Albert P. Brogan
I
Most of us know, in a general way, that public opinion has had different standards for the moral judgment of men and of women. We know also that reformers, especially feminists, have condemned these so-called double standards. But no definite study has been made of the exact nature of recent public opinion about double standards. So we do not know exactly what the double standards have been or exactly what evolution they may be undergoing. In the present article, an attempt is made to determine what are the characteristics and the changes which may be found in one phase of popular double standards, that of American college students.
In an earlier article in this Journal for January, 1923, a study was presented of what may be called general worseness or comparative value. That study showed that there is in public opinion a very definite scale of comparative moral values, and that this scale is remarkably uniform among students in different universities in America. This scale may be called general worseness, because it makes no sex distinctions. The students were asked whether one practice is worse than another, no matter whether both were done by men or by women. Although the investigation of this scale gave very definite results, it is clear that there is another question to be asked. How bad would each practice be if done by a man, and how
( 106) bad if done by a woman ? The answers to these questions give what will be called the scales of double standards. The results concerning these double standards will be an exhibition of one interesting phase of public opinion, will throw some light on the ethics of the double standards, and will present some novel results concerning the use and authority of statistics.
The material used in this study consists of the same sixteen "worst practices" that were used in the earlier article. These practices will be found in any of the following tables. The practices were listed by the students themselves without any help or suggestions from the teacher. They were then put in alphabetical order and given to the students for further work. This work was done at the beginning of a course in elementary ethics, before any class or textbook discussion of problems could influence the students. Usually the sheets were unsigned, but this precaution did not influence the results noticeably. Three rankings were secured from each student. First, the students were asked to rank the practices in the order of what they considered worse for a woman to do. These figures give a scale of comparative badness for women's actions. For the sake of brevity, this scale will be called worseness for women. Then the students were asked to state for each practice whether that practice is worse for a man to do than for a woman to do, or whether it is worse for a woman to do, or whether it is about equally bad for men and for women. These figures give what I shall call the "criss-cross," as they enable us to tie together the scale for men and the scale for the women. Finally the students were asked to rank the practices according to the comparative badness for men. This gives what will be called the scale of worseness for men.
The tables and figures presented in the present article are based upon student judgments collected at the University of Texas from 1921 to 1924, and also upon some material from the University of Chicago and other universities during the same years. Since the results about the scales of double standards
( 107) are rather intricate and perplexing, the figures for the academic year 1922-23 at the University of Texas are printed in detail, and then other results are compared with them. In this one year at Texas, the figures were collected from 126 men and from 99 women. Each student gives three judgments about each of sixteen practices. Somewhat over a thousand students have been studied with reference to double standards. So the present article summarizes the statistical characteristics of approximately 50,000 judgments.
II
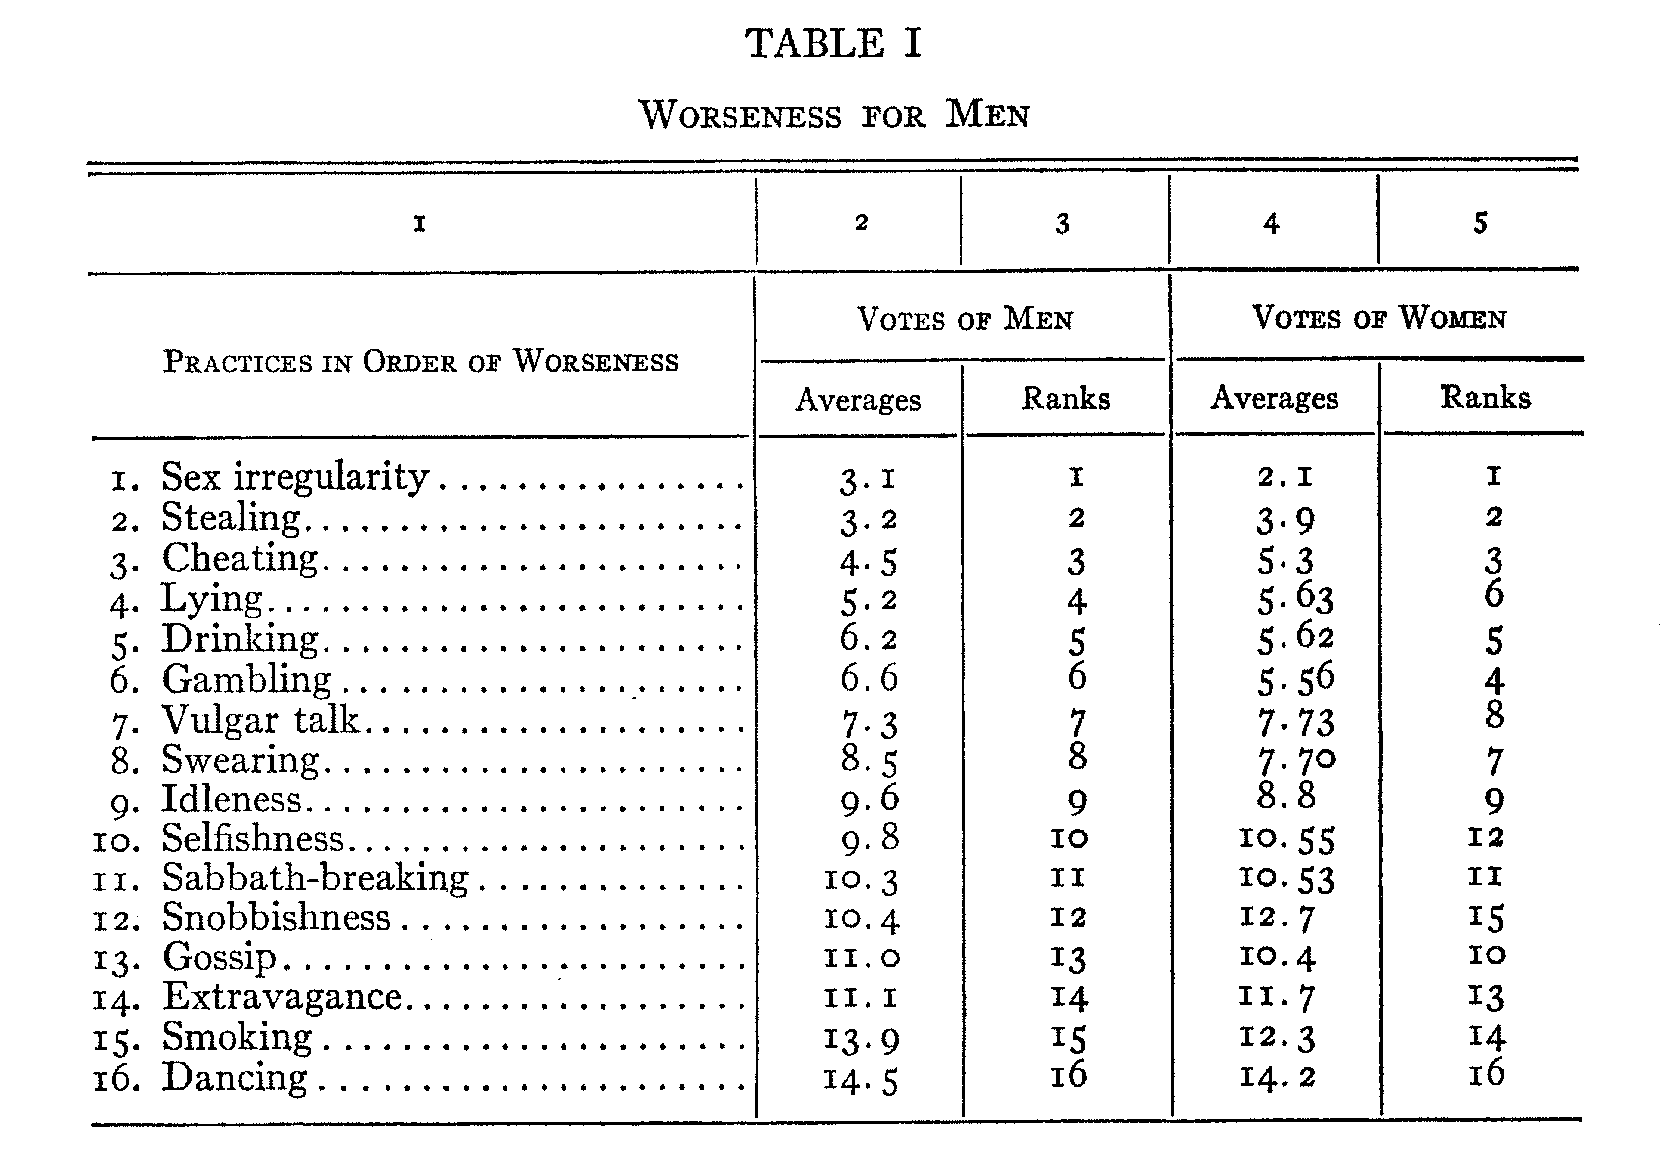
The scale of worseness for men is given in Table I. The practices are listed in the order given by the men, with the worst at the top. Column 2 shows the arithmetical averages as given by the men, with the corresponding rank in column 3.Columns 4 and 5 give the averages and ranks according to the votes of the women about the men. The reader will notice that the rank given by the men about the men is very similar to the rank given by the women about the men. The coeffi-
( 108) -cient of correlation is positive .95. This is a very high correlation, though it is not as high as the correlations for the scale of general worseness. The only important differences in this scale of worseness for men concern gambling, snobbishness, and gossip. There is a tendency for the women's averages to lump several practices as being approximately on the same level.
The medians and the ranks by medians are-omitted in order to save space. Their correlations with the ranks by averages are between .98 and .99. (Since most of our correlations are very high and positive, they are to be understood as positive unless separately labeled negative.) The dispersion was studied in connection with the medians. The quartiles for the men about the men range from 1 to 2 1/2. The average of the quartiles is 1.94. The average of the women's quartiles about the men is 1.62.
III
Table II shows the scale of worseness for women. The arrangement of columns is the same as in Table I. When the ranks in columns 3 and 5 are compared, we find the extremely high correlation of .99. In other words, there is virtual identity between the men about the women and the women about the women. There is no difference of more than one rank. There are four instances where two practices exchange their ranks. But it would be difficult to find any significance in a one-point divergence in rank.
When the rank in column 5 is compared with the rank by medians the correlation is .99. The dispersion is similar to the dispersion for the figures about the men. The average of the quartiles for the women about the women happens to be exactly the same as for the men about the men, 1.94. The average of the quartiles for the men about the women is 1.81. Each sex has a smaller dispersion in its judgments about the opposite sex than in its judgments about itself. I do not know how to explain this fact.
( 109)
IV
Are we now in a position to compare the rank of what is worse for men with the rank of what is worse for women ? We can do so, but only superficially. We can find the correlations between the different ranks but we cannot draw inferences about the comparative badness of any practice with respect to the two sexes. Thus the women rank gossip higher in the scale of worseness for women than in the scale of worseness for
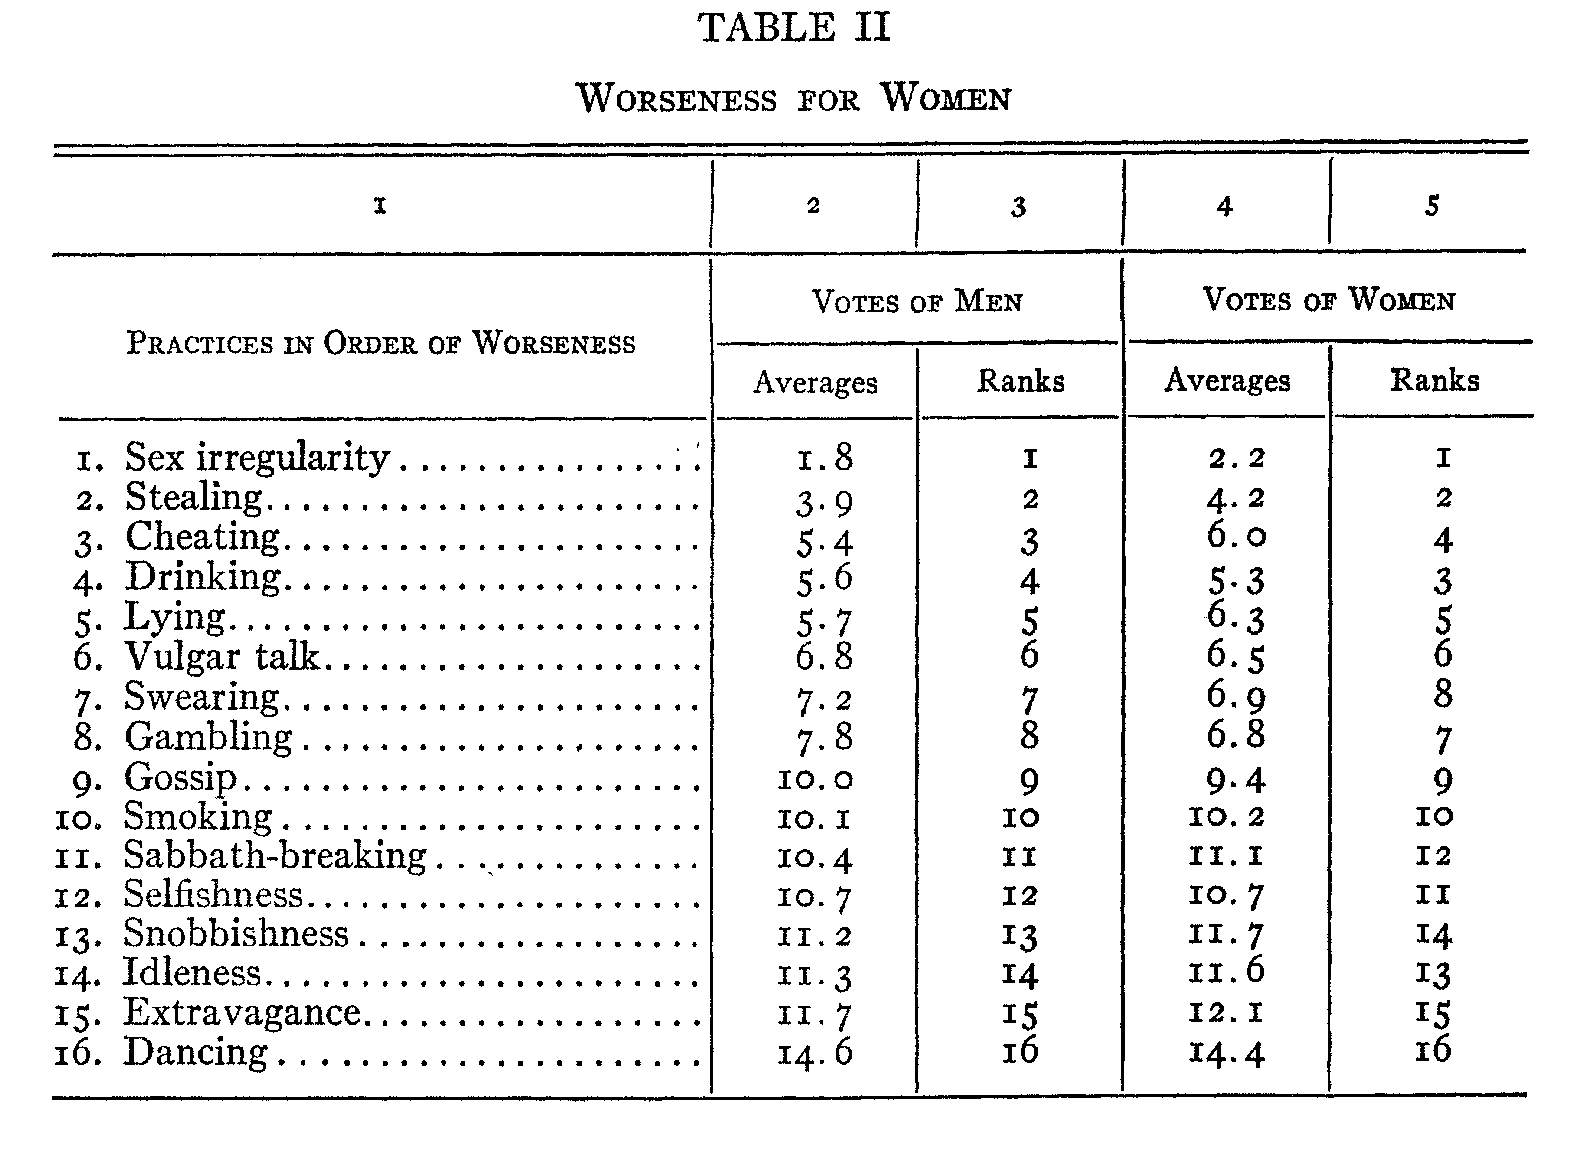
men. Does this imply that gossip is worse for women than for men? We are not yet in a position to say. The reader may be referred to one result in the article on "Group Estimates of Frequency of Misconduct," published in this Journal for April, 1924. Stealing was placed as 16 (least frequent) among the men, but 12 among the women. Yet when our tables were completed we found that stealing was 'placed as less frequent among the women. There were other practices which were less frequent among the women and these crowded
( 110) stealing up to position 12, even though it was less frequent than among the men. Now so far we have no knowledge whether there might be a similar condition in the double-standard figures. Abstractly it might be that every practice is considered worse for women than for men. From our two similar ranks we can neither affirm nor deny this possibility. We need what has been called the criss-cross, that is, the figures for the answers to the direct questions whether each practice is worse for a man than for a woman, and so forth.
In the meantime all we can do is to note certain correlations. The women about the two scales have a correlation of .92. The men have a correlation of .89. The men about the men and the women about the women have a correlation of .90.These are still rather high correlations. If we rested with these figures, we should be inclined to say that there is no noteworthy double standard in the morality of these American students. The only exceptions concern smoking and idleness.
V
The figures for the so-called criss-cross are given in Table III. This table shows, as the reader will recall from the introductory section, the answers to the questions whether each practice is worse for a man to do than for a woman to do, or worse for a woman, or about the same in badness. The answers were tabulated according to the threefold division, and then turned into percentages. For example, there was a very small percentage voting that cheating is worse for men, a majority voting that it is the same in badness, and another small percentage voting that it is worse for women. As there were no note-worthy differences between the votes of the men and the votes of the women, the results were thrown together. However, the main figures for the two sexes will be shown separately. In order to use these threefold divisions for our purposes, they were subjected to the same treatment that was used in the similar figures for frequency of misconduct. (See this Journal,
( 111) XXXIV, 261-63.) The total number of votes about each practice was divided into the sum of the votes saying "worse for men" plus one-half of the votes saying "same in badness." This method gives a scale of percentages such that the smallest percentage indicates most agreement that that practice is worse for women than for men, and the largest percentage indicates most agreement that that practice is worse for men. Please notice that this is a scale of relative agreement among opinions but not a scale of badness.
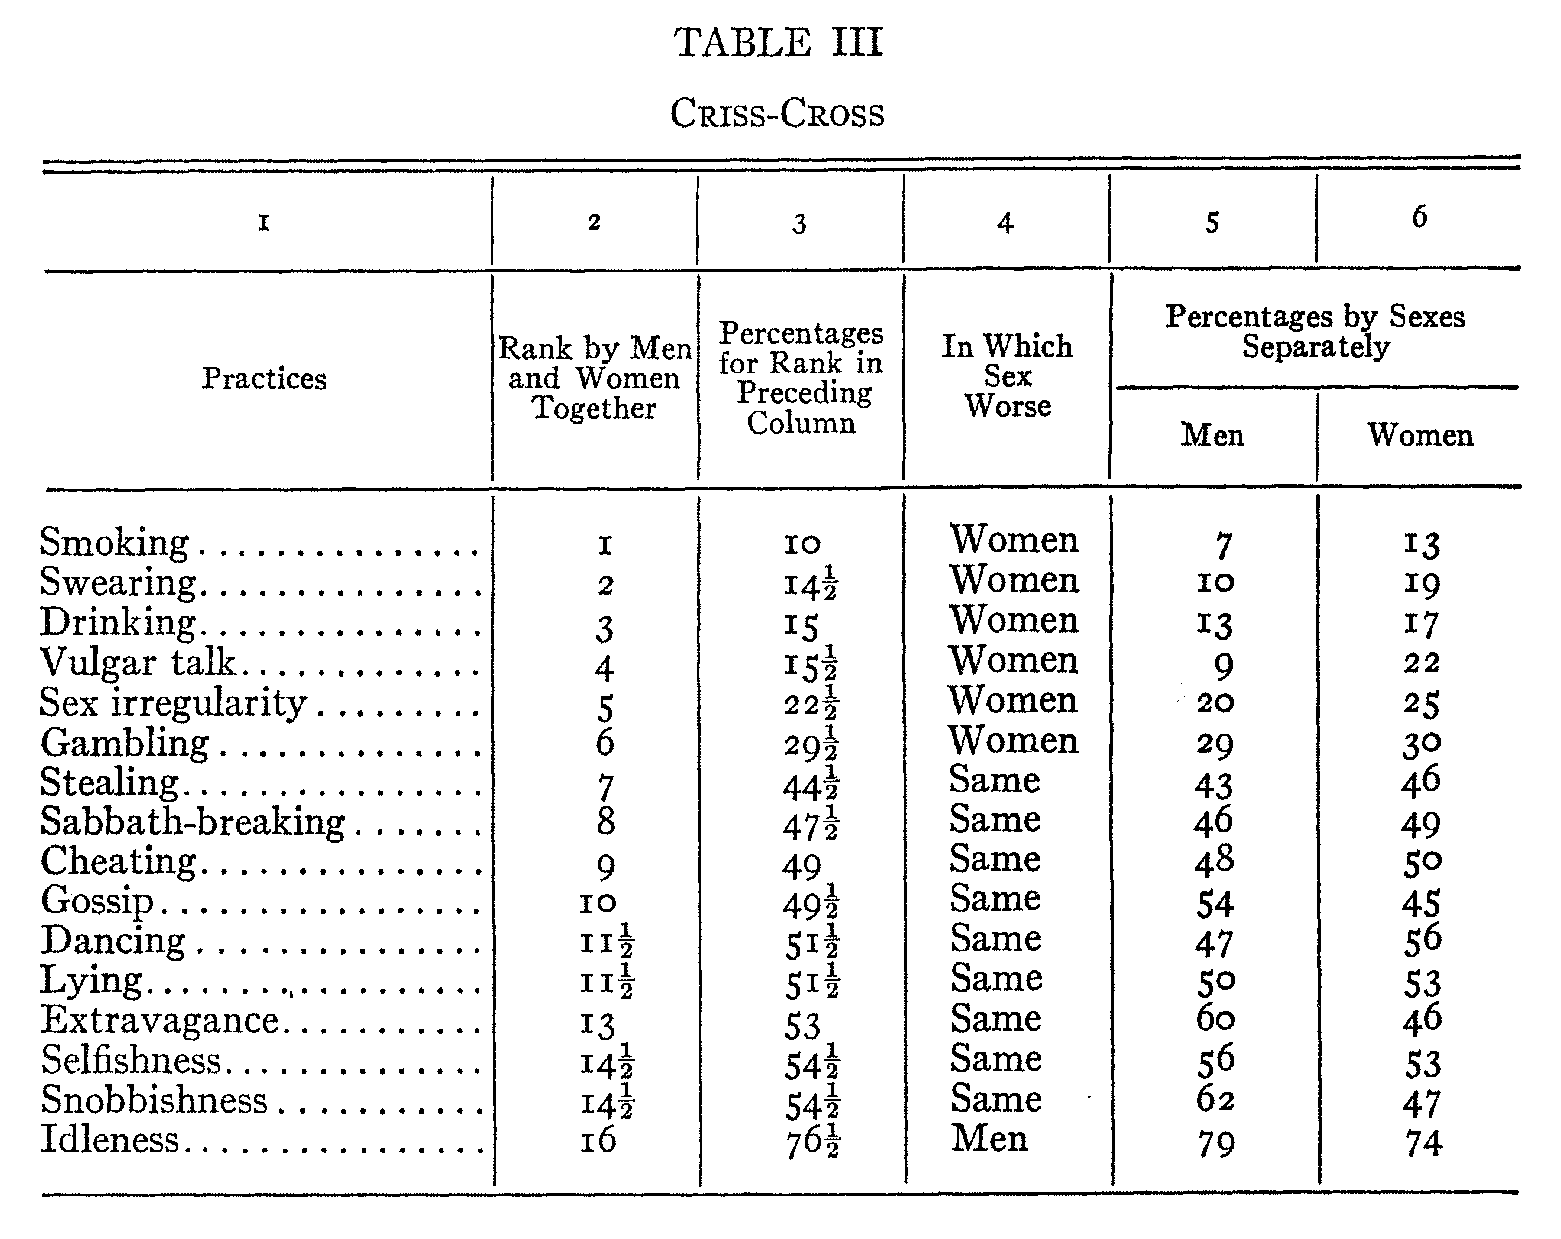
Column 5 of Table III gives the percentages according to the men, column 6 according to the women. With few exceptions, the women tend to give percentages which are closer to 50 than the men's percentages. This means that they are some-what more reluctant to admit double standards in morality.
Column 3 gives the results of adding the percentages in columns 5 and 6 and then halving them. In other words, it gives the combination of the votes of the two sexes without
( 112) regarding the greater number of men than of women. Column 2 gives the rank for the practices according to column 3. Thus there is most agreement that smoking is worse for women and that idleness is worse for men. The other practices are in between these two. Column 4 classifies all the practices according to the figures in column 3. Practices with percentages from o to 33 are called worse for women. Practices with percentages from 34 to 66 are classified as the same in badness. Practices with percentages from 67 to 100 are called worse for men. Idleness is the only practice which is voted to be worse for men than for women. There are six practices which are considered worse for women: smoking, swearing, drinking, vulgar talk, sex irregularity, and gambling. The other nine practices are considered about the same in badness, as the percentages for the combined votes run from 44 to 54.
VI
We are now ready to tie together the scales about the two sexes by the use of the so-called criss-cross. I shall use the word "co-ordination" for this process of tying together. Table IV shows the co-ordination for the men's votes. Column 1 gives the averages for the men about the men. Column 6 gives the averages for the men about the women. Columns 3 and 4 give the results for the criss-cross. Both columns give the same information, but column 3 gives the information for each of the men's practices as arranged in column 2, while column 4 gives the same information for each of the women's practices as arranged in column 5. In columns 3 and 4, the letter "M" stands for "worse for men," the letter "W" stands for "worse for women," and the letter "S" stands for "same in badness." When the letter "S" occurs in column 3 the reader should look across to the right and see that the same practice is on (approximately) the same line in column 5. When the letter "W" occurs in column 3 the reader should glance to the right and upward until he sees the same practice in column 5.
( 113) In the one instance of a practice worse for men, the reader should look down from position 9 among the men to position 14 among the women. This table was constructed by first tying together all the practices which were considered the same in badness. Then the other practices were fitted around these "same" practices.
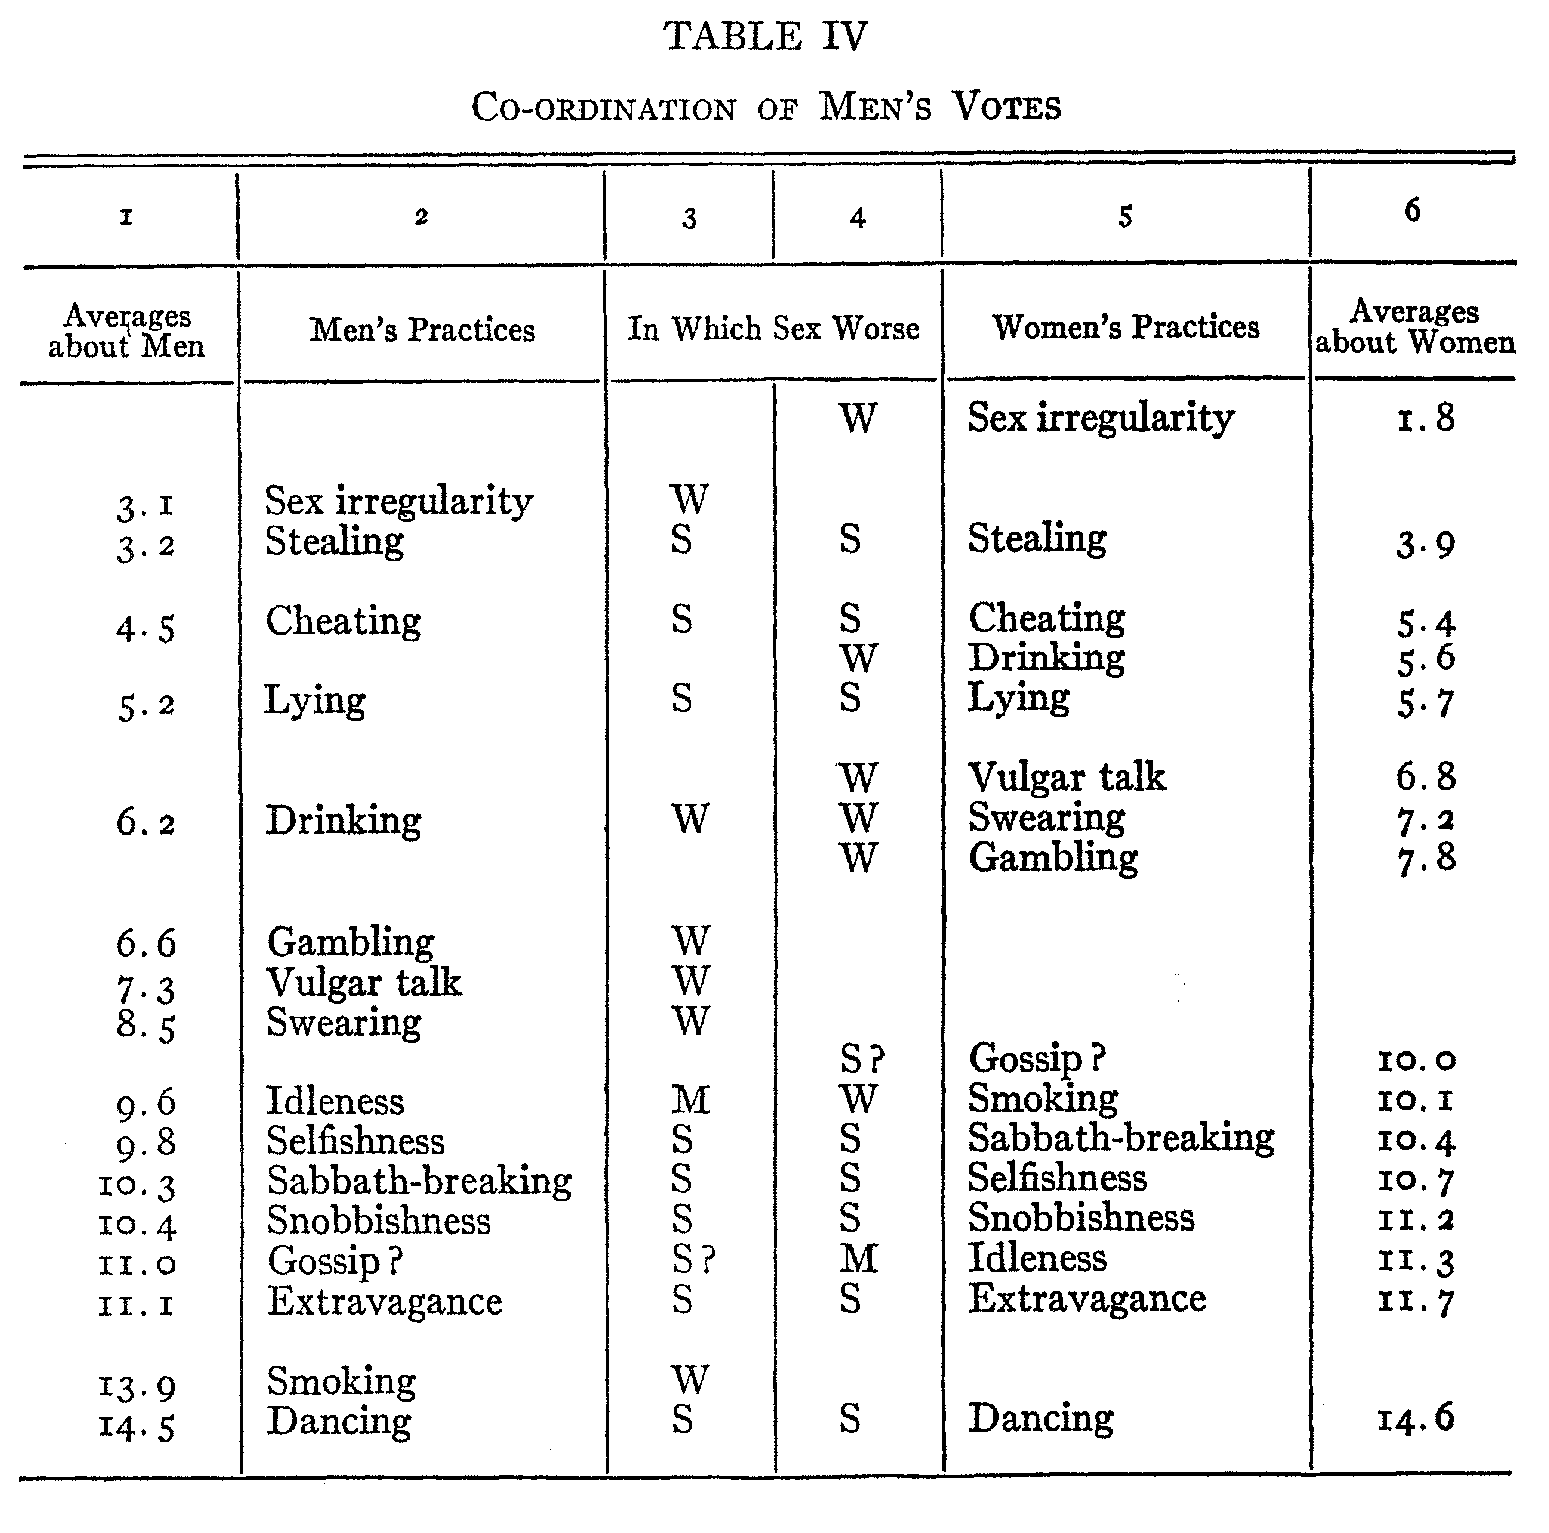
On the whole the men's votes about the men's practices and about the women's practices seem to fit together fairly well. There is just one place where trouble occurs. Concerning gossip there seems to be a self-contradiction in the men's votes. This group of men judge as follows: (1) Women's gossip is worse than women's selfishness. (2) Women's selfishness is the same in badness as men's selfishness. (3) Men's
( 114) selfishness is worse than men's gossip. (4) But women's gossip is the same in badness as men's gossip. It seems to me undeniable that if X is worse than Y, and if Y is equal in value to Z, and if Z is worse than W, then X must be worse than W. But this logical truth seems to be denied by this group of men. Let us look at the matter in this way : The two ranks in columns 2 and 5 seem clearly to imply that women's gossip is worse than men's gossip. Yet the criss-cross in column 3 or 4 asserts that women's gossip is equal in value or badness to men's gossip. I cannot pretend to explain this contradiction with any assurance. Gossip is listed in the frequency scales as the most frequent practice among the women. In the scale of general worseness, gossip is ranked 13 by the men and 10 by the women. This difference may be due to the fact that most women are more easily injured by gossip than most men. In Table V of this article we shall see that women put gossip about equally bad for men and for women in position g or I 0. Now why do the men put gossip as 13 among the men and g among the women, and yet say it is equally bad in both sexes ? I can theorize about this matter but I have no proof as yet.
I do not know whether anyone has ever discovered such a statistical contradiction before or not. Of course many instances of low or negative correlations have been discovered, but we are dealing with something totally different. Probably it would be impossible to discover such self-contradiction except where human opinions were being studied. Moreover, self-contradiction could never be discovered unless a triple set of statistics were being used, and unless all were from the same group. With only two sets of statistics nothing could be discovered except high or low correlations. What our threefold tables show is a contradiction held by the same set of individuals about the same set of topics.
With the exception of the facts about gossip, there is no real contradiction in Table IV. There might seem to be a slight contradiction in the ranks of Sabbath-breaking and selfishness.
( 115) But the arithmetical averages are so close together that the exchange of positions is unimportant. The reader will notice that even in the figures about gossip, the arithmetical averages differ by only one point. So the self-contradiction, while real, is not as great as it might easily be.
In the co-ordination of the tables about frequency of misconduct, no self-contradiction appeared, though the possibilities for contradiction were the same as for contradiction in this table about double standards.
VII
The co-ordination of the women's votes about double standards is shown in Table V. The order of the columns is the same as in Table IV, but all the votes are by women.
The women have a contradiction not about gossip but about gambling. The arithmetical averages are crowded so close together that it might be doubted whether we have a real contradiction here.. But as the ranks stand, we find the following judgments: (1)Men's gambling is worse than men's lying. (2) Men's lying is the same in badness as women's lying. (3) Women's lying is worse than women's gambling. (4) But women's gambling is worse than men's gambling. These judgments clearly imply that men's gambling is worse than women's gambling and also that women's gambling is worse than men's gambling. This is surely an absurd self-contradiction. It would be easy to indulge in unverifiable theories about this contradiction concerning gambling. Instead, I shall point out one interesting fact. In the criss-cross for the frequency of misconduct tables, gambling is at the top as being most typically masculine. Gossip is at the bottom as being most typically feminine. So we get the result that the most typically feminine practice gives rise to contradiction among the men, and the most typically masculine practice gives rise to contradiction among the women. I do not know whether this relationship explains the contradiction in any way.
( 116)
Some day we must study the reasons for all these popular valuations. Such a study must include the reasons for these contradictions. But at present we must concern ourselves with the prior task of description rather than with the later task of explanation.
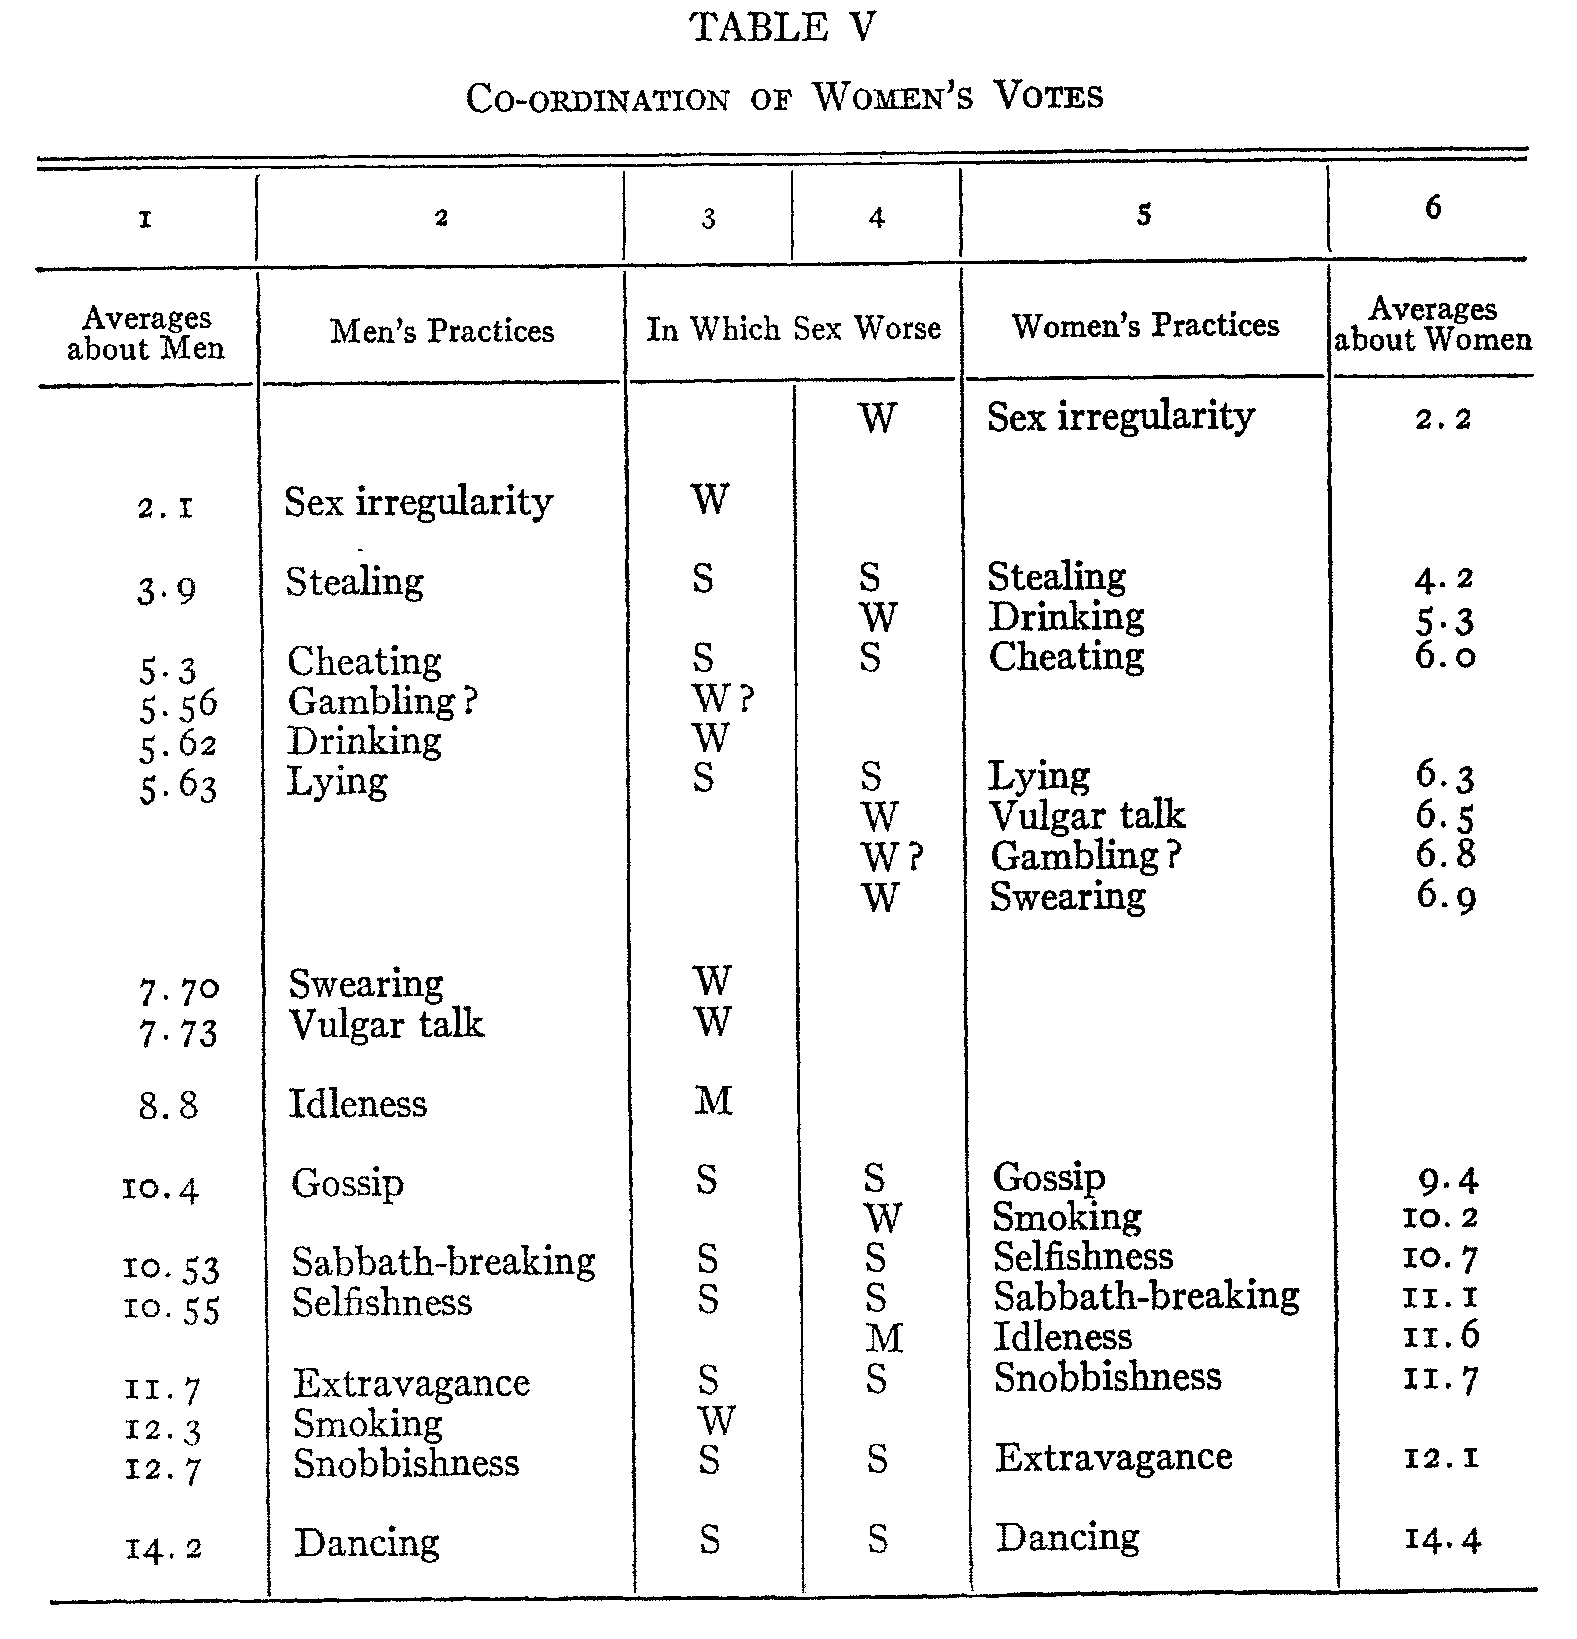
The rest of Table V seems to be free from contradiction. There is an exchange of ranks between snobbishness and extravagance, but this hardly deserves to be called a contra-diction.
The women's chart as given in Table V is very similar to the men's chart as given in Table IV. The high coefficients of
( 117) correlation have already been given in the accounts of Tables I and II.
N0TE.-The reader should be cautioned that the spatial differences which I have used in Tables IV and V do not correspond exactly to the differences in the arithmetical aver-ages. These tables indicate only approximate relative position. They do not pretend to give anything like quantitative measurements by the spatial differences.
VIII
We are now ready to compare the double-standard scales with the scales for general worseness and for frequency. These
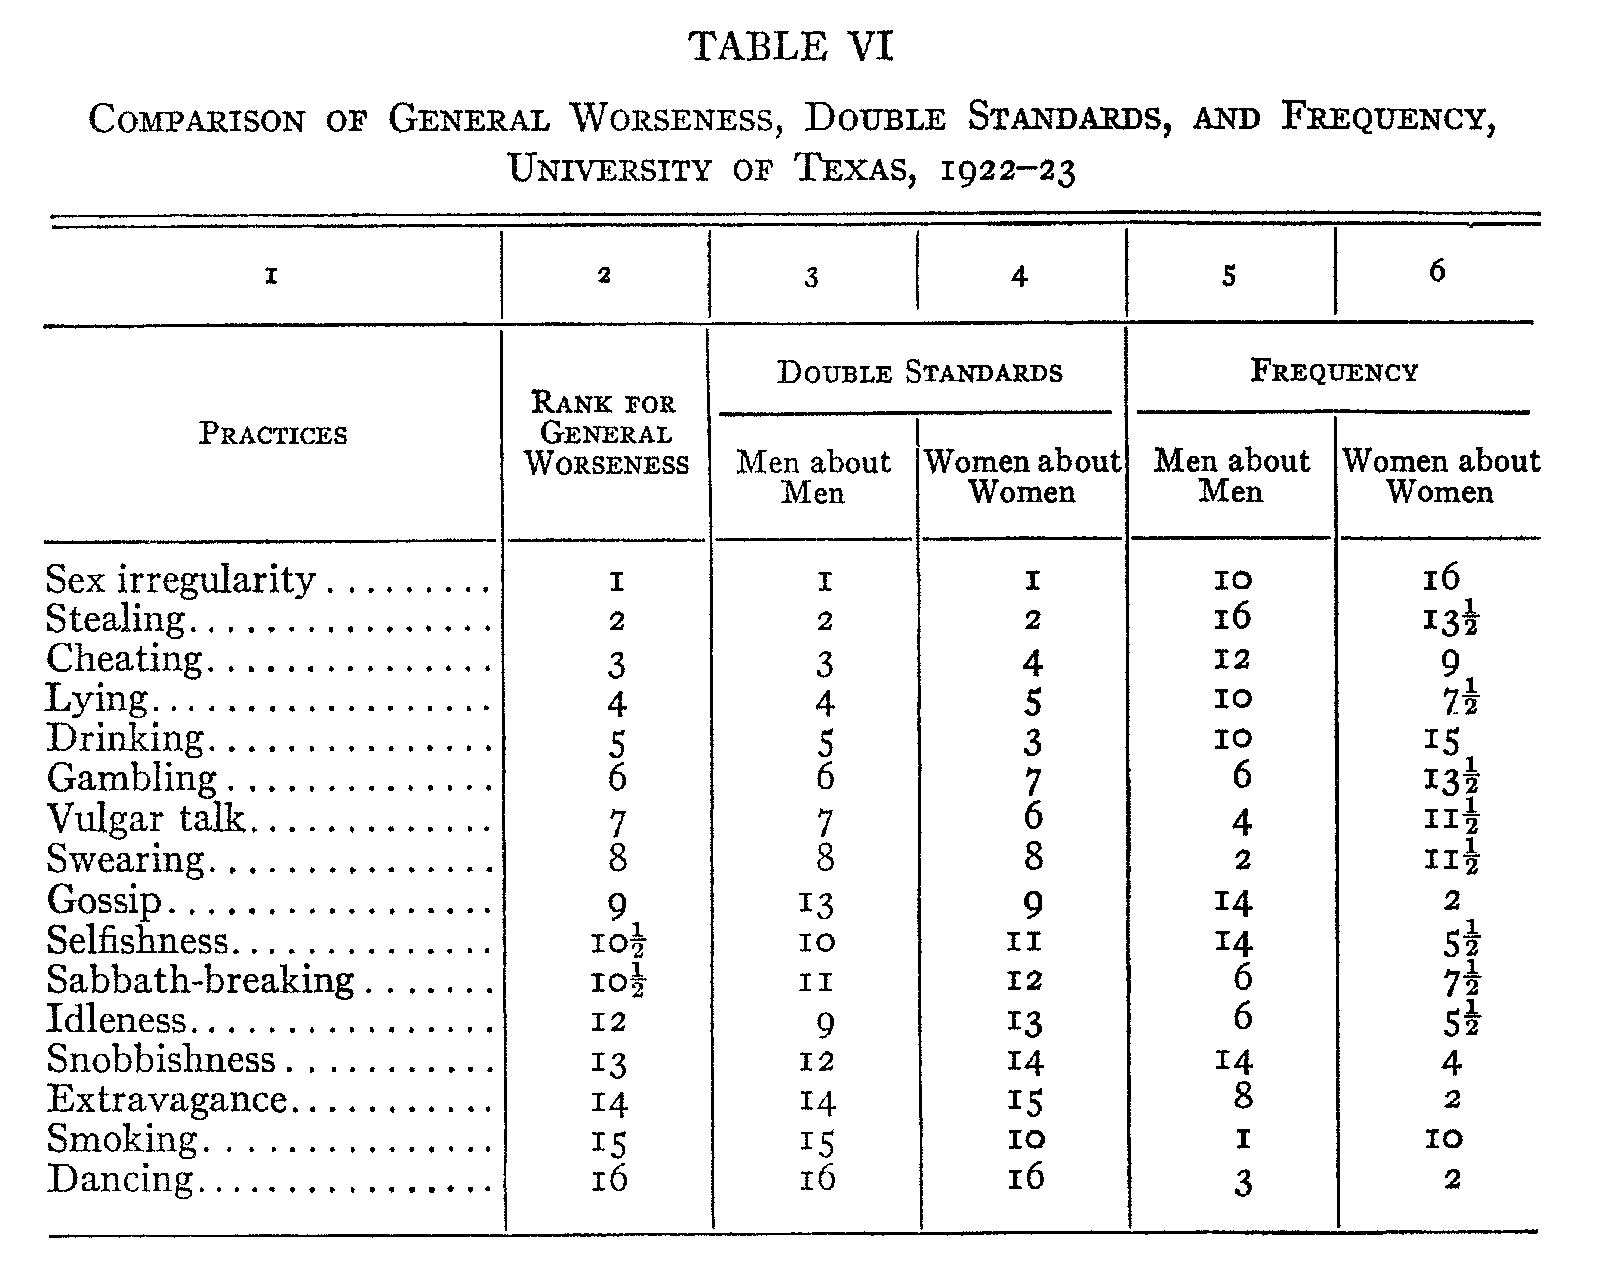
scales are shown in Table VI, for the academic year 1922-23 at the University of Texas.
Column 2 of Table VI shows the combined votes of the men and the women about general worseness. As the two sexes showed a correlation of .g7, they were combined in one rank.
( 118) This rank has a correlation of .99 with the similar rank for the figures for the years 1919-21, as published in this Journal for January, 1923 (XXXIII,125). The only important difference is a slight change in the rank of Sabbath-breaking, which seems to be moving slowly in the direction of the position which northern students give it. When the scale of general worseness in column 2 is compared with the scale of the men about the worseness for men in column 3, the correlation is .96..When the scale of general worseness is compared with the scale of the women about the worseness for women in column 4, the correlation is .95. Columns 3 and 4 have a correlation of .90. On these figures one would be inclined to deny that there is any noteworthy double standard in popular morality. Yet our so-called criss-cross has shown very decided double standards. The rank method alone is not fine enough to bring out the divergent characteristics of the popular double standards.
The frequency scales in columns 5 and 6 are very similar to the scales for 1918-22 which were published in this Journal for April, 1924. The men have a correlation of .92 with the earlier scale, and the women have a correlation of .5. The main differences are that drinking among the men and smoking among the women are ranked as increasingly frequent. When the frequency for the men (column 5) is compared with the general worseness scale, the correlation is negative .42. For the women the correlation is negative .72. When the men's frequency is compared with the worseness for men, the correlation is negative .36. But when the women's frequency is compared with the worseness for women, the correlation is negative .83. This big difference seems to indicate more of a causal relation between women's standards and women's conduct than is to be found among the men. There is a good positive correlation between comparative badness for women and comparative infrequency for women. For the similar facts among the men, only a low correlation is found.
The scale formed by the so-called criss-cross is so com-
( 119) -plicated in its meaning that I shall not attempt a detailed discussion here of the significance of the various correlations between this criss-cross scale and other scales. But a few correlations may be given for the reader who cares to analyze them. When the double-standard criss-cross is compared with the scale of worseness for men, the correlation is positive .27. For the women, the correlation is positive .57. For the double-standard criss-cross and the similar criss-cross for frequency, the correlation is positive .85.
IX
So far we have confined our study to the figures for the men and the women at the University of Texas during the academic year 1922-23. Let us now consider the figures for other years at the University of Texas and at other American universities. These other figures cannot be printed here in full, but each set of figures will be compared with the set of figures we have studied, the coefficients of correlation will be given, and any noteworthy differences will be described.
At the University of Texas, the figures for 1922-23 can be compared with the academic years 1920-21 (spring term only), 1921-22, and 1923-24. For the men about the worseness for men, the correlations are, in the order given, as follows: .99, .98,.98. When each year is compared with every other year, the correlations run from .95 to .99. The average of the correlations is .97, with a standard error of .01. For the women about the worseness for women, the comparison of the year 1922-23 with the other years shows a correlation of .98 in every case. When all the years are compared, the correlations run from .96 to .98. The average correlation is nearly .98, with a standard error of .or. When the so-called criss-cross scales for the different years are compared, the only noteworthy differences are about drinking and smoking. There is a clear tendency, both among the men and among the women, to be more unanimous in placing these practices as worse for women
( 120) than for men. There seems to be no other considerable or important difference in any of the Texas figures during these four years.
Materials about double standards have been sent to me from several northern universities, all indicating a general similarity to the figures we have been studying. I shall limit myself to an account of the figures from the University of Chicago, partly because those figures are typical of most northern figures, partly because I have two adequate sets of figures from Chicago, one for the year 1923 and another for 1924. As the Texas figures are about the same for the different years, I shall compare the Texas figures for 1922-23 with the figures for Chicago for the two years studied.
When the scale of the Texas men about the worseness for then is compared with the scales of the Chicago men for 1923 and 1924, we find correlations of .97 and .96, respectively. The corresponding figures for the women about the worseness for women are .90 and .95. At Chicago both sexes put Sabbath-breaking lower, just as they did in the general worseness scales. But it should be noticed that the Texas students are moving in the direction of the northern students in this matter. The women at Chicago put smoking lower and selfishness higher than the women at Texas. Otherwise all the scales are fairly similar. At Chicago the men about the worseness for men in the two years have a correlation of .97. The correlation for the women about the women is also .97.
The most striking differences between Texas and Chicago are to be found in the criss-cross figures. In general, it may be said that the Chicago students tend Much more strongly to a single standard than the Texas students. There are really three levels in the criss-cross figures which I have tabulated. The men at Texas (as shown in Table III) have a very definite set of double standards about seven of the sixteen practices. The women at Texas tend more to a single standard by giving
( 121) figures which are closer to 50. The men at Chicago give almost exactly the same figures for the criss-cross that the Texas women give. Both hold double standards but less strongly than the Texas men. In particular, the Texas women and the Chicago men place gambling and sex irregularity close to the dividing line between the "same" practices and the practices which are worse for women. The Chicago women go farther. They place gambling and sex irregularity as definitely the same for men and for women. Then they place drinking, vulgar talk, and idleness close to the dividing line from the "same" practices. So the Chicago women have strong double standards only about smoking and swearing, and less emphatic double standards about drinking and vulgar talk as worse for women, and idleness as worse for men. Thus we have three levels of judgments, the Texas men with strong double standards, the Texas women and the Chicago men with moderate double standards, and the Chicago women with almost negligible double standards. As to the future characteristics of similar groups of men and women, the reader can predict as well as I can.
X
If it would not be too complete a reversal of the method of most discussions in philosophy and ethics, I should be tempted to leave this article as all facts and no conclusions. But I shall give a few comments without much theorizing.
This article has shown further possibilities of the use of statistical methods in the study of popular opinion, especially about ethical matters. The figures about double standards have shown very definite results with high correlations. The facts studied have been more complex than the facts previously studied about general worseness, and have been more variable. In particular, the figures for the double-standard criss-cross showed several distinct types of attitudes about double standards.
( 122)
These studies in the different aspects of statistical ethics have been concerned with the central tendencies of each group. The central tendencies represent fairly closely the middle half or two-thirds of each group. On the basis of this knowledge of the central-group tendencies, later studies can be made of individual or eccentric differences.
Every group judgment about double standards which I have studied carefully and fully has developed an explicit self-contradiction. This contradiction is important, but it must not be overemphasized. The reader is asked to consider whether the contradictions which this article has shown are as great as are to be found in most books written by famous and supposedly logical philosophers.
The self-contradictions in our double-standard scales may serve one very useful purpose. Several readers of my first article on statistical ethics have complained that such results would be used to coerce individuals into accepting the group judgments, whether the group judgments were really wise or not. This criticism is important, though I might plead that it is not my fault if people misuse my results. Moreover, the figures about frequency of misconduct seemed to be very reliable as evidence about actual behavior, and this fact might be used to support the reliability of the general-worseness figures. But, as I said in my first statistical article, I do not wish to set these scales up as norms or authorities. They are facts to be studied rather than accepted. But what shall we do if people insist on accepting them uncritically ? Well, the contradictions we have found in the double standards can be very helpful. The naïve mind may be unduly open to group suggestion, but it is usually not so uncritical as knowingly to accept an explicit self-contradiction. Only a mind spoiled by too much shallow philosophy can do that. So we can use the self-contradictions in the double standards for the purpose of making people be critical about the group rankings. The
( 123) group rankings cannot be treated as infallible, because they contradict themselves. So every individual should criticize them and make his own scale of values.
It is hardly necessary to point out the profitable use that can be made of these double-standard figures in the teaching of introductory ethics classes. Most students are interested in the problem. The self-contradictions and the differences in the criss-cross arouse thought and demand study. A beginning can be made with something like a project method in the teaching of ethics. The results obviously call for ethical and philosophical discussion. The opposition between traditional and reflective standards is brought out very clearly. Finally, the various aspects of the problem of equality are given an enlightening factual basis.
The facts brought out both in the double-standard scales and in the criss-cross seem to offer still more empirical verification for my earlier philosophical theory about the melioristic interpretation of value. (Journal of Philosophy, XVI, 96-104.) All facts about value are facts about the relation of betterness or worseness. Popular opinion seems to be perfectly in harmony with this theory. While it is true that I asked the groups for a scale, yet they could not have given such uniform and definite answers unless they already possessed the scale of values in their minds.
The present article has been concerned almost entirely with description of the double-standard facts. Of course there are other things to be done. The double standards need genetic study from the anthropological, sociological, and psychological points of view. But without our present accurate description of part of present-day morality, the genetic study tends to explain away rather than to explain. It tends to assume that the present is nothing but the past genesis of itself. This is frequently false. Moreover, we need to formulate reflective criticisms of all these moral attitudes. But the criticism should
( 124) come after and refer to the existing facts. It should aim at controlling the direction of change for the better. This can hardly be done without accurate factual knowledge such as we have been trying to present. Finally, some people will think that the whole problem of a double standard is to be condemned emotionally rather than studied intellectually. To them I must quote Spinoza that our task is "neither to ridicule nor to lament nor to detest but to understand."
UNIVERSITY OF TEXAS