Group Estimates of Frequency of Misconduct
Albert P. Brogan
I
At frequent intervals we are told either that human morals are improving or that there is a serious moral decline in the younger generation. Careful proof has seldom been offered for either assertion. Each critic has assumed that his personal impression is sufficient evidence. We need some objective and impersonal method by which we can prove what changes are taking place in contemporary moral standards and conduct. In a recent article, published in the International Journal of Ethics for January of 1923, I presented the results of an inquiry into the moral standards or valuations of present-day public opinion. That article described the scale or rank of comparative badness according to which university students ranked sixteen practices. The present article studies the same practices in order to see if public opinion has a definite rank for the comparative frequency of these practices. It is a study of group estimates of frequency of misconduct.
There were many theoretical problems and hypotheses which the present writer had in mind while making this investigation. These problems included a method for studying public opinion, the reliability of public opinion as evidence about actual behavior, the comparison of the value scale and the frequency scale, the interpretation of the meaning and objectivity of the value scale, and the use of such material in the teaching of ethics. These problems will be discussed in the conclusion to the present article. They are mentioned here in order that the reader may have these larger problems in mind as he reads the numerous details that follow.
( 255)
Whether this study is philosophy or psychology or sociology, I shall not pretend to say. It was undertaken in connection with the teaching and investigation of ethics. It clearly forms a legitimate part of an empirical ethics. The nature and the relations of an empirical ethics cannot be discussed here.
II
For the study of comparative frequency, use was made of the same list of sixteen "worst practices" that was used in the study of comparative badness. This list of practices will be found in any of the tables which accompany the present article. As a full account of the making of this list has been given in the previous article, it is unnecessary to go into details here. The list was made entirely by the students without any influence from the teacher. Each student was asked to hand in a list of the ten "worst practices" which he knew among students at the university. There happened to be sixteen practices which stood out as being most frequently mentioned. These sixteen practices were put in alphabetical order for further study. Students were asked to rank these practices according to the greater frequency of them among the men students at the university, and then similarly among the women students. They were also asked to state for each practice whether it is more frequent among the men, or more frequent among the women, or the same in frequency. The figures given in the present article are based upon figures collected during seven terms from the spring of 1919 to the spring of 1922, inclusive. The students were mainly Sophomores with some Juniors and Seniors, who were taking the introductory ethics course. In order to exclude any influence from the teacher, the rankings were made during the first week of the course, in the classroom, and without signatures. In later years changes were made such as requiring the students to fill out the blanks at home and hand them in with the signatures. But such changes did not produce any difference in the results.
( 256) For this article use was made of the rankings of 258 men and 312 women.
These sixteen practices are obviously classes. No attempt was made to give rigorous definitions for any of them. They were left on a purely popular or common-sense basis. For the study of comparative badness, it was a slight defect that each practice included several types of actions which might have differing values. No such defect occurs in the use of these practices for the study of comparative frequency. Such a relation as comparative frequency obviously holds between classes. It would be possible to study frequency among classes which had been defined with an approach to mathematical accuracy. But such a method would be hostile to the spirit of the present study, which tries to let popular opinion express itself without influence from any critic. The same' remarks may be made about the relation of greater frequency. No attempt was made to define this relation. In spite of this lack of logical definitions, popular opinion uses these classes and this relation in very definite and uniform ways, as the following pages will prove.
III
Table I shows the estimates about the frequency among men at the University of Texas. Columns I-7 give the men's estimates both by separate years and by the total of all the years. Column 8 gives the total of the women's estimate about the frequency among the men. All of the ranks are based upon arithmetical averages. One set of medians is given in Table IV. The rank by the medians and the rank by the arithmetical averages seldom differ 1 per cent.
Examination of columns 2-5 will show that there are numerous slight variations from year to year, but no significant change unless the figures for drinking indicate such a change. Unfortunately, I have no figures for pre-prohibition days. But, apparently, drinking has increased among the men students from 1919 to 1922. During the first three years
( 257) drinking ranked 14 or 15 (which is a very low rank), but during the last year it sprang up to II. The figures for the following year (1922-23) are not complete, but drinking seems to be at position to.
When we compare the ranks for the different academic years as given by the men, we find that coefficients of correlation
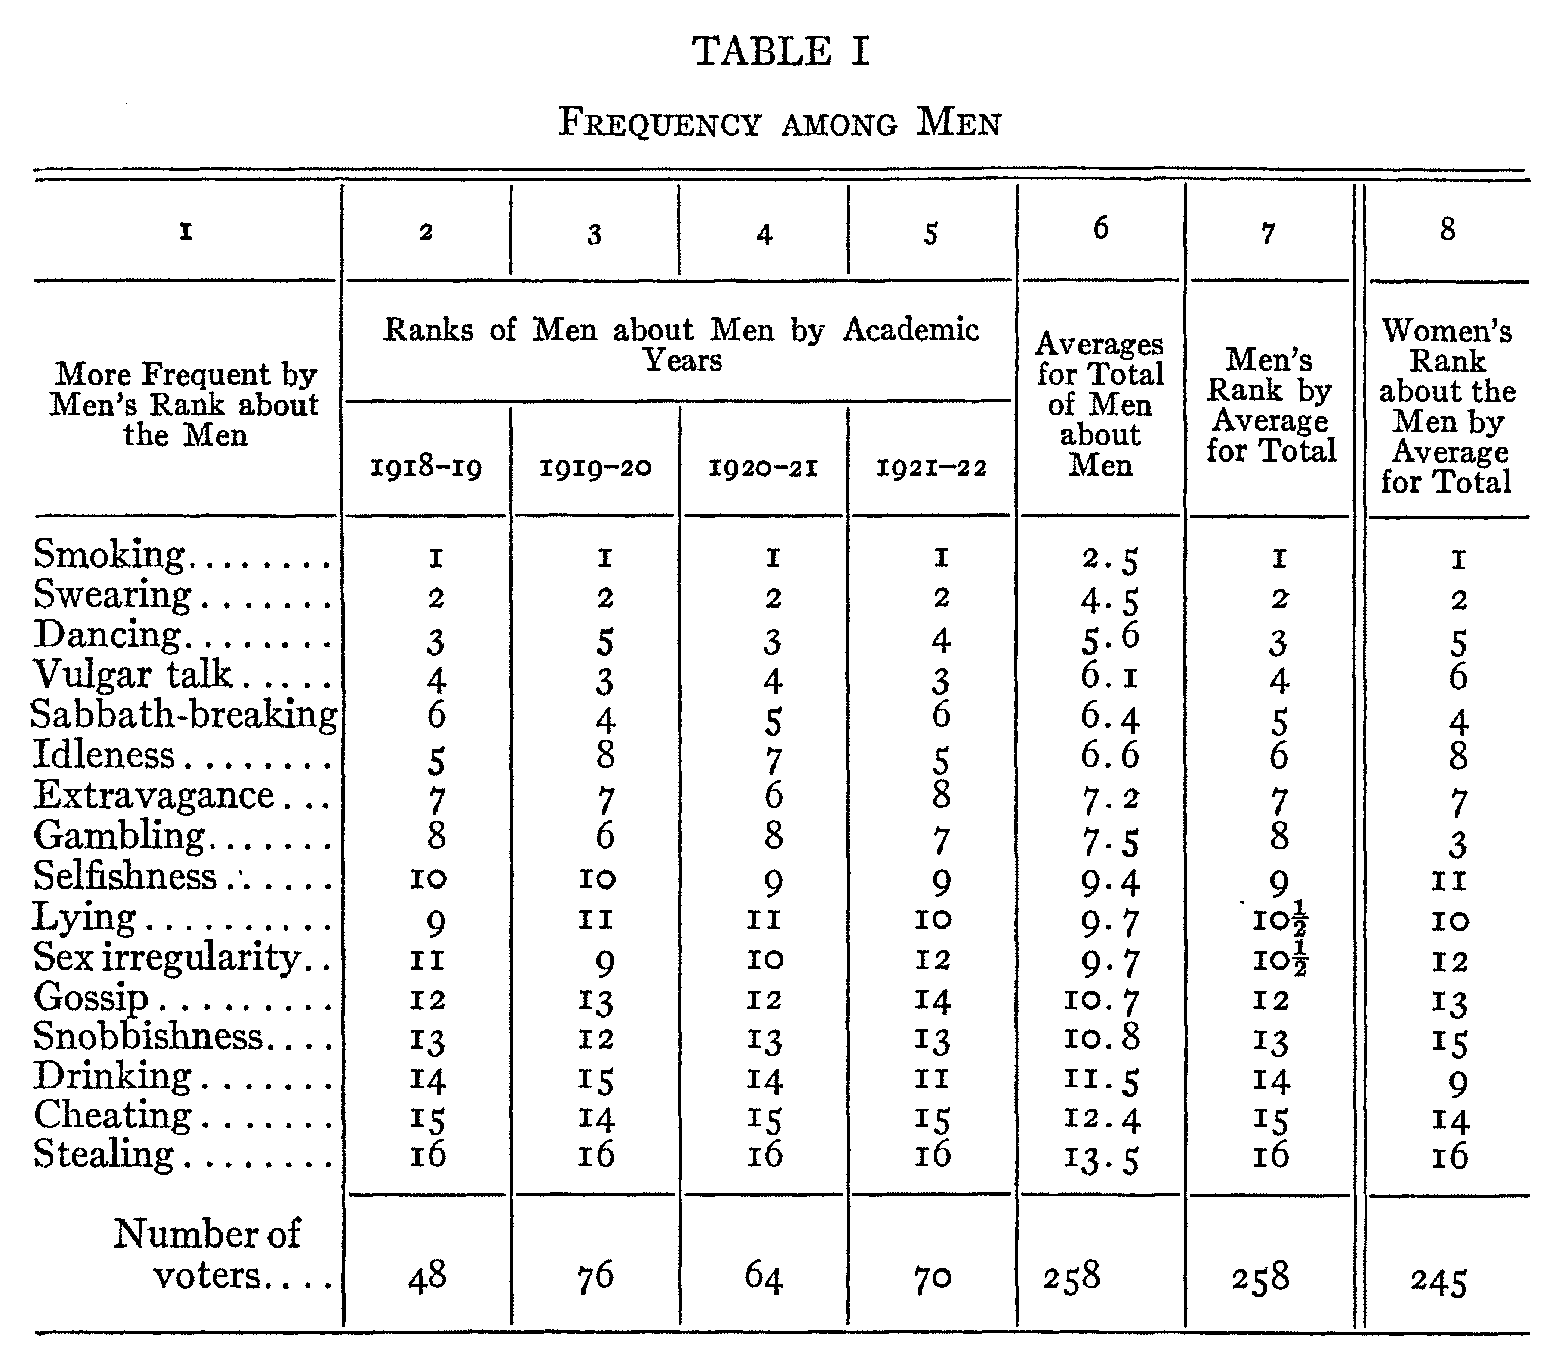
among these ranks run from .95 to .98. The average correlation is .96, with a standard error of .02. As all. of my main correlations are positive, I shall assume it understood without repetition. When the ranks for the separate years are compared with the total rank in column 7, they have an average correlation of .98, with a standard error of .01.
The total rank as given by the men and the total rank as given by the women have a coefficient of correlation of .90, with a standard error of .05. The reader will notice that there
( 258) are only two practices concerning which there was serious disagreement between the two sexes. The women think that both drinking and gambling are more frequent among the men than the men think. These two differences are the only important ones in either sex as ranked by either sex. What is the cause of the difference, and which rank is more reliable ? I have used as my main material the rank of each sex about itself. Then I have given the -other for comparison. My reasons are as follows. It seems natural to take each sex about itself because each sex would probably have more information about itself than about the opposite sex. Then the coefficients of correlation for the men about the men are somewhat lower than for the women about the men. As there are no significant differences between the two sexes concerning the frequency among the women, there is no problem there.
IV
The frequency among women students is given in Table II. Columns 1-7 give the women's estimates about the frequency among the women. Column 8 gives the men's estimate about the frequency among the women. In other respects the arrangement of columns is the same as in Table I.
The reader will notice how much more uniform the ranks by the different academic years seem to be than was the case with the men's ranks. In reality there is only 1 or 2 per cent more uniformity among the women, but this slight increase brings the ranks so near to identity that it is very noticeable. The coefficients of correlation for the women's ranks by the separate academic years run from .97 to 1.00. The average correlation is .98, with a standard error of .or. The correlations of the academic years with the total for the women have an average of .99, with a standard error of .005. When the rank by all the women about the women is compared with the rank by all the men about the women, the coefficient of correlation is found to be .98, with a standard error of .01 . This is
( 259) virtual identity. The only difference worthy of comment is about idleness, which the men think is slightly more frequent among the women than the women think.
In studying the detailed differences from year to year in the women's ranks about the women, there are only two differences to be noticed. One very slight difference concerns
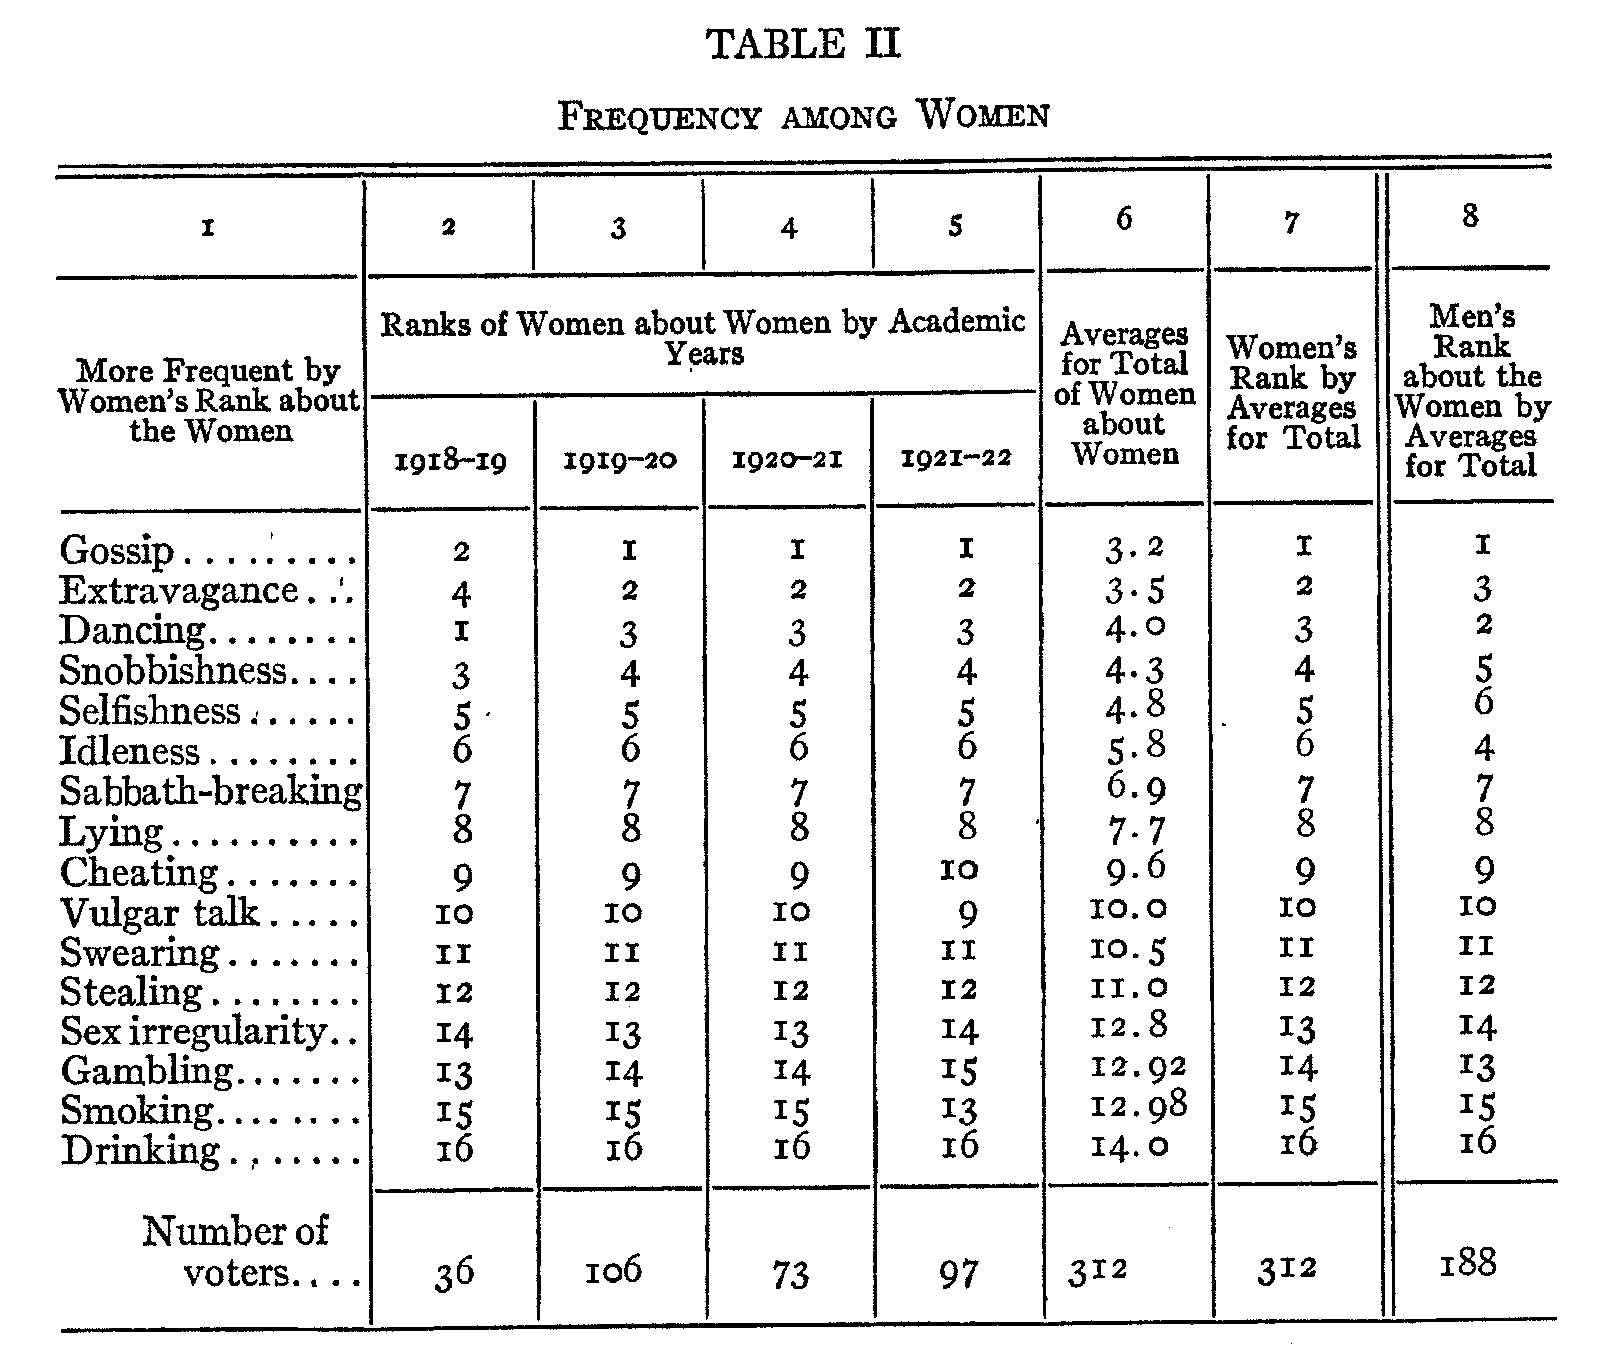
extravagance. In the war-year 1918-19, extravagance is put as less frequent than in the following years. I think that this difference gives considerable evidence concerning the accuracy and freedom from mere tradition of our figures. The other and more pronounced difference is about smoking among the women. The figures that I have given show only a two-point increase in the ranks of smoking. But the figures by the three terms of each of the last two years are more significant. I give the figures for smoking during the seven terms
( 260) from the fall of 1920 to the fall of 1922, inclusive : 15, 15, 14, 14, 13, Ir, ro. This last rank of ro is exactly the same as the rank for women's smoking in several of the northern universities. It is probable that smoking among the women in the northern universities was prevalent earlier than among the women at Texas. But I have no figures concerning the northern universities earlier than 1922.
V
Table III gives a picture of the dispersion or deviations for the academic year 1921-22. During the previous years I had been mainly interested in studying the scale of com-
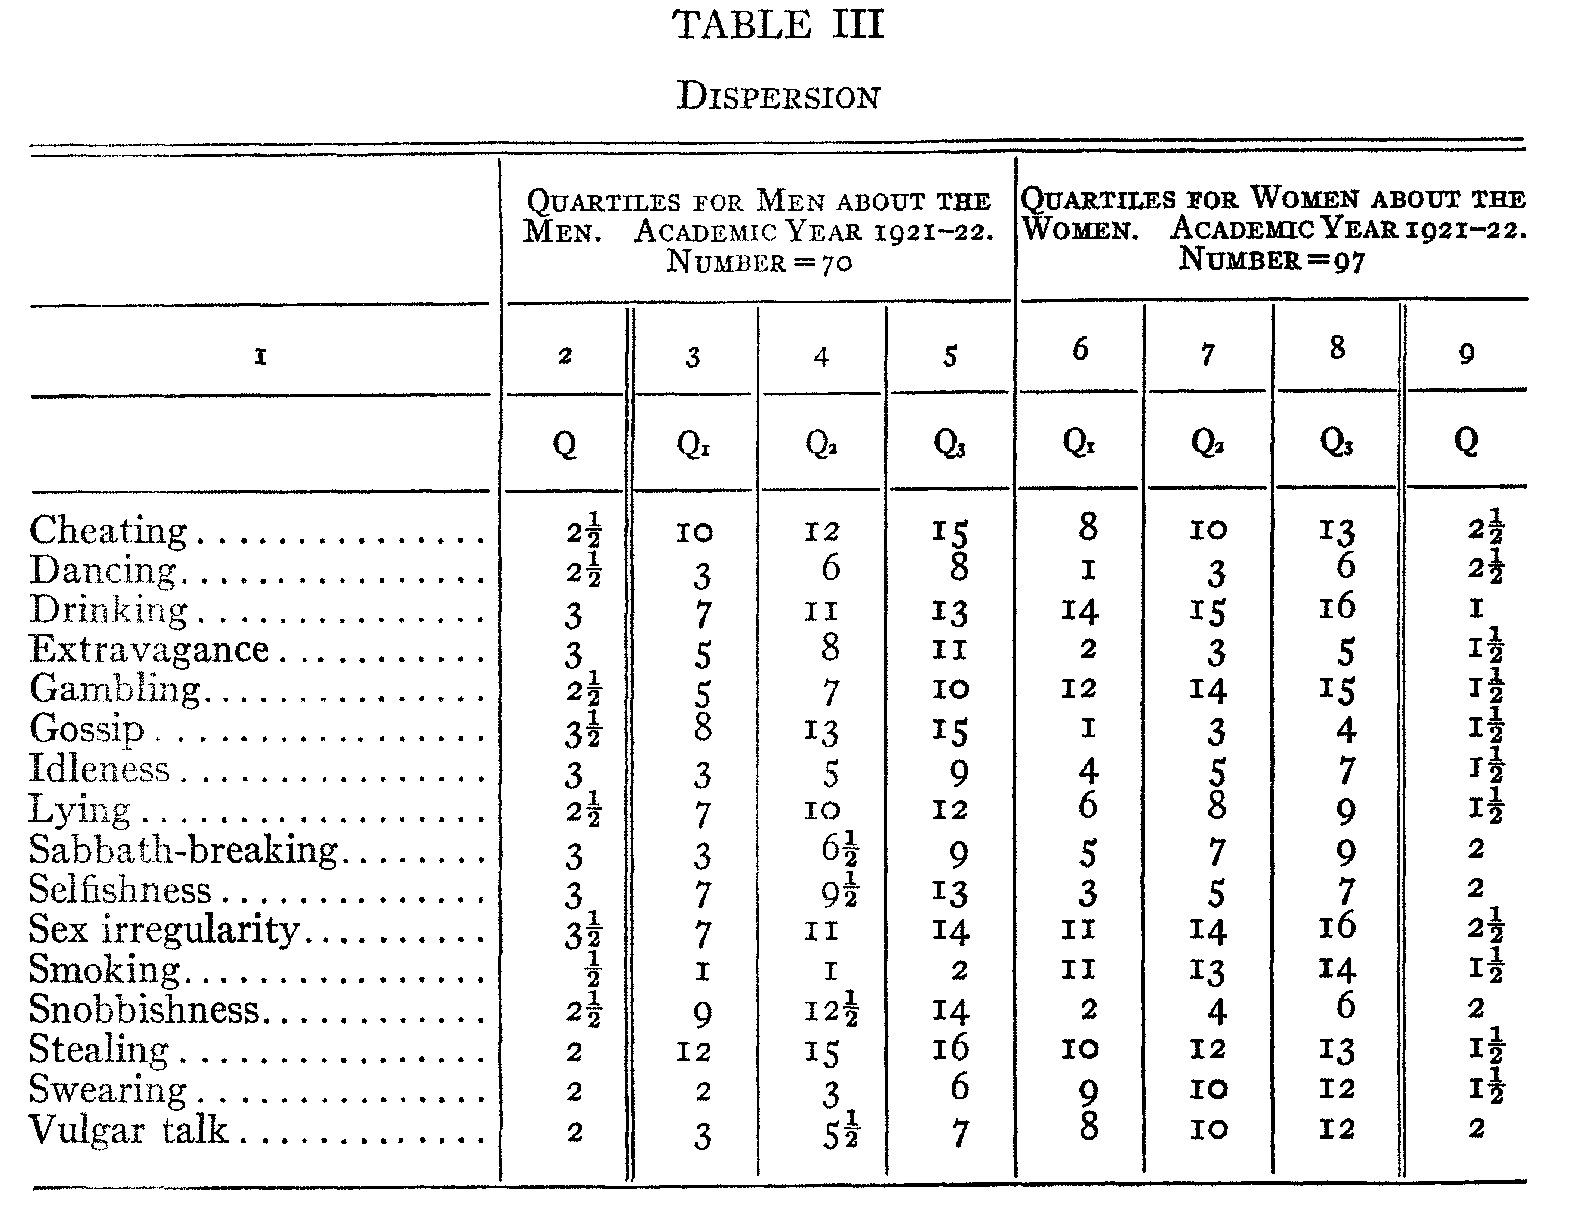
- parative valuations, and so had made no use of the frequency estimates except to get the ranks, by averages. It has not seemed profitable to go back over this earlier material to study the dispersion, so I give only the figures for the seventy men and the ninety-seven women in the one academic year.
( 261)
Columns 2-5 give the figures for the men about the men's frequency, and columns 6-9 give the figures for the women about the women's frequency. Columns I and 9 give the quartiles for the men and the women, respectively, that is, one-half of the difference between the 25 percentile and the 75 percentile. The average quartile for the men is 2.56, and for the women it is 1.78. The medians (or Q,) are given in columns 4 and 7.
VI
We have now finished the study of the separate ranks about the men's frequency and about the women's frequency. But what is the relation between the men's rank about the men and the women's rank about the women ? Does the same number in the two ranks indicate equal frequency ? To make the question more concrete, let us consider the place of stealing in the two ranks. - For the men stealing is in position 16 or last, but for the women stealing is in position 12. Does this indicate that stealing is more frequent among the women than among the men ? At first thought, this would seem to be the inevitable conclusion, but it may be incorrect. So far we have no real basis for comparing our two ranks. Abstractly, it is possible that every one of the men's practices might be more frequent than any one of the women's practices. Or the relation might be reversed. We can go no further without new facts.
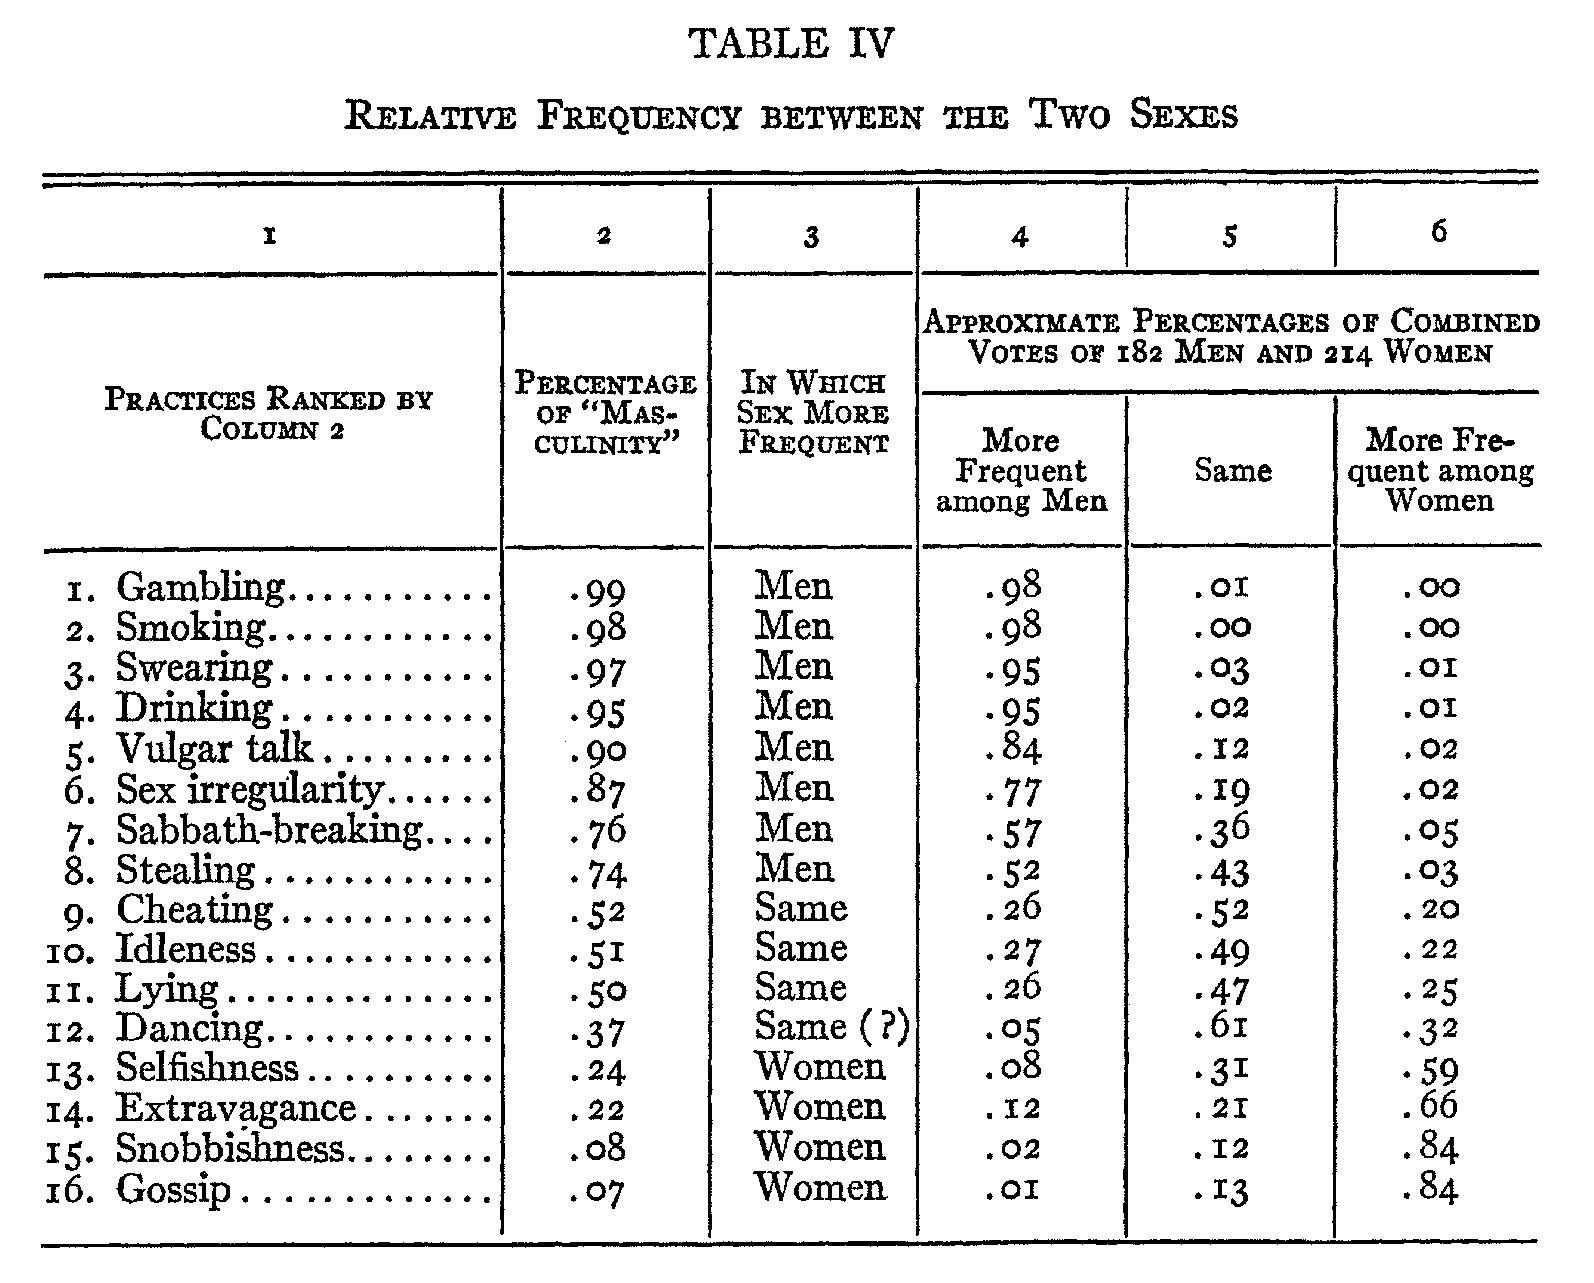
To meet the foregoing difficulties, the students were asked to state for each practice whether it is more frequent among the men, or more frequent among the women, or the same in frequency. As there seemed to be no noteworthy differences between the answers of the men and the answers of the women, all the figures were lumped into one set of 396 voters, as given in Table IV. Columns 4-6 give the first results expressed in terms of approximate percentages. For example, consider drinking. Approximately 95 per cent of all voters agreed that drinking is more frequent among the men, 2 per cent
( 262) said that drinking is the same in infrequency, and i per cent said that drinking is more frequent among the women. So the case of drinking is fairly clear, and we are entitled to say (as in column 3) that drinking is held to be "more frequent among the men." But some of the other practices are not so clear. We need some mathematical device with which to divide the practices into the masculine, the feminine, and the
equal practices. Unfortunately, I have not been able to discover in the available literature on statistics a device for dealing with such triple divisions. So I have had to adopt a makeshift which is by no means perfect but which perhaps gives sufficiently reliable results. Any criticisms or suggestions concerning this problem will be very welcome.
For each practice I took all of the "men" votes and half of the "same" votes, then this total was balanced against all of the "women" votes and half of the "same" votes. On this
( 263) basis a so-called "scale of masculinity" was constructed, as given in column 2. The percentage for each practice represents the sum of the "men" votes and half of the "same" votes, divided by the total number of votes. Several other methods of constructing this scale were invented, but none of them seems entirely satisfactory, and all of them give about the same result. Notice that the scale in column 2 is almost the same as the rank in column 4, which is based only on the votes for "men."
This "scale of masculinity" will be found useful for many statistical purposes, but here we are concerned to use it only for the purpose of deciding which practices are voted more frequent among each sex and which are voted the same. The divisions are given in column 3. When the percentages of "masculinity" ran from 100 to 67, the practices were labeled "more frequent among the men." When the percentages ran from 66 to 34, the practices were considered (approximately) the "same." When the percentages ran from 33 to 0, the practices were labeled "more frequent among the women." The only questionable practice is dancing, which is on the lower edge of the "same" practices. The results are as follows. Gossip, snobbishness, extravagance, and selfishness are more frequent among the women. Dancing, lying, idleness, and cheating are approximately the same. The other eight practices are more frequent among the men.
VII
We are now prepared to answer the question which was left unanswered at the beginning of the previous section. Stealing is 16 in frequency among the men, and 12 among the women, but it is somewhat more frequent among the men than among the women.
Table V gives the results of tying together the main figures of Tables I and II (each sex about itself) with the help of Table IV. We first tie together the four "same" practices —dancing,
( 264) idleness, lying, and cheating. This gives a rough method for fixing the place of each practice with reference to the opposite sex. The other practices are spaced in each column according to the differences between the arithmetical averages. But neither the position nor the spacing must be taken as completely
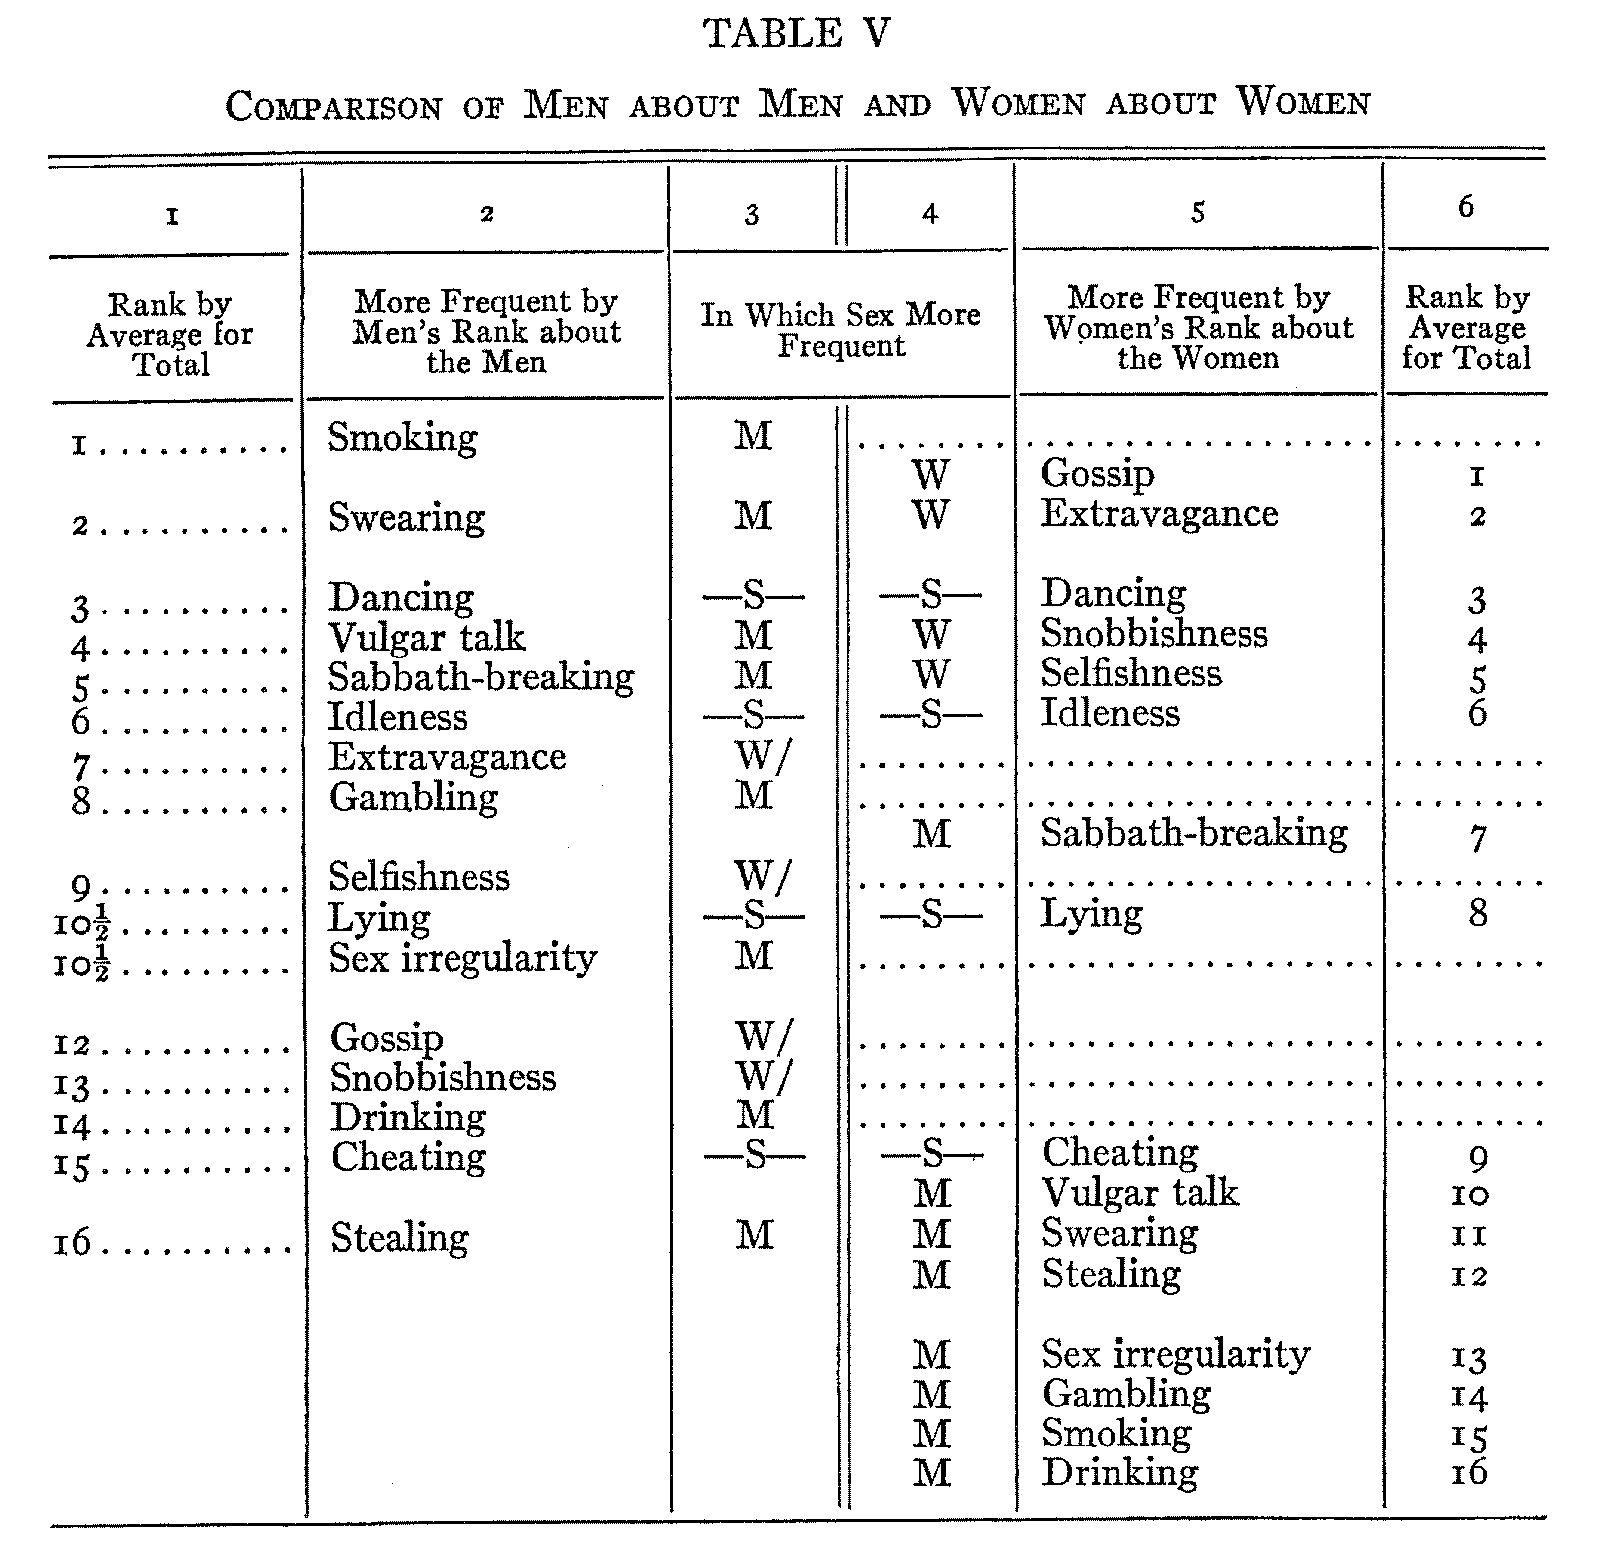
accurate. This table indicates approximate relative position. It must be left for later investigations to show whether it is possible for other methods to give greater precision to such results. At present, I do not know of such methods. The nearest approach to such methods is the Thorndike-Hillegas order-of-merit method, but that method seems incapable of dealing with the triple facts which are included in Table V.
( 265)
In Table V, column 3 gives the classification by sex frequency for each practice according to the results of Table IV. Column 4 gives the corresponding facts for the practices in column 5.
Please notice that there is complete consistency among the two ranks and the tying-together results. To illustrate, let us suppose that Sabbath-breaking had been ranked second in frequency among the women, but that all other figures were about the same. In this case, there would be a manifest inconsistency, because Sabbath-breaking would be above dancing in the women's list, but the tying-together figures would indicate that it should be much lower. That there is no such inconsistency in any of our figures is an indication of their trustworthiness.
It is interesting to notice the practices among the women which are less frequent than any of the practices among the men. There are five of these practices-stealing, sex irregularity, gambling, smoking, and drinking. In the year 1922-23 smoking would not be down in this part of the women's list but would be up above swearing.
Notice the position of selfishness with reference to the two sexes. There was no disagreement between the two sexes here; both agreed that selfishness is more frequent among the women than among the men. These results should be compared with the traditional doctrine in our textbooks that altruism and benevolence were caused by the "maternal instinct."
VIII
At the present day there is much popular discussion concerning the so-called "double standard." I hope to publish soon some statistical results on this problem. Here the indisputable fact may be pointed out that there is a system of "double behavior." When the men's rank about the frequency among the men is compared with the women's rank about the frequency among the women, the coefficient of correlation is positive
( 266) .03. This correlation is about the same as a purely chance correlation. So far as these sixteen practices are involved, there is no similarity between the men's behavior and the women's behavior.
Is there any relation between the scale of frequency and the popular opinion about the comparative badness of the same practices? When the men's rank of frequency among the men is compared with the men's rank of comparative badness, the coefficient of correlation is negative .56. For the women the corresponding figure is negative .58. In other words, there is a moderate negative correlation between greater frequency and greater badness.
When the men's scale about the frequency among the men is compared with what has been called the "scale of masculinity" (Table IV), there is found a positive correlation of .36. Then the "scale of masculinity" was reversed and the resulting "scale of femininity" was compared with the women's rank about the frequency among the women. Here the coefficient of correlation is positive .75. Apparently, the women are more influenced in their behavior by the comparative masculinity or femininity of a practice than the men are.
IX
The figures and tables given above furnish the main content for the present article. They give a fairly complete study of public opinion about the frequency of sixteen practices in a fairly typical American university community. This article cannot study the detailed facts about Texans outside of the university or about town or gown in other American states. I have some figures concerning these other groups. These figures are enough to show that the results of the present article are fairly typical of much wider circles. Only the coefficients of correlation will be given here, mainly because the figures used are less complete than the figures for the University of
( 267) Texas. It is clear that a detailed study of each community should be made by someone who is on the ground.
Concerning the cities or towns in Texas, the only figures available are estimates made by university students. Such figures are unsatisfactory, but no better ones are yet available. They indicate a general similarity. When the rank of the men about the frequency among university men is compared with the rank of the university men about the frequency among the men in the home towns, the coefficient of correlation is positive .93. The corresponding figure for the women is also positive .93.
Figures about frequency are available from two northern universities—the University of Chicago and the University of Wisconsin. For the men about the frequency among the men, the correlation between the University of Texas and the University of Chicago is positive .95. The corresponding figure for the women is positive .95.. These figures compare Texas during 1919-2 2 with Chicago during 1922. The reader will remember that smoking among the women seems to have been increasing. This fact accounts for a large amount of the moderate difference between the women at the two places. When the women at the two universities are compared for the fall of 1922, the correlation is positive .99. In other words, there is almost no difference between the women of the two places when allowance is made for the influence of time on the practice of smoking. The men seem to maintain their 5 per cent difference at all times.
The figures from the University of Wisconsin unfortunately do not separate the votes of the women from the votes of the men. So we may expect the same tendency for the women to put drinking and gambling more frequent among the men, just as we found this tendency at Texas. The men about the men at Texas and both sexes about the men at Wisconsin have a correlation of positive .93. A large amount of this
( 267) difference is caused by the figures concerning drinking and gambling, as we expected. The correlation for the women at the two places is positive .98. For the women the figures are for the year 1922 in both places. This correlation is virtual identity.
So we may conclude that the tables given in the present article are highly representative of American college life, and that these tables are somewhat representative of ordinary American life outside of colleges or universities.
X
The interpretations of our results must be short. The method used in this investigation obviously gives an empirical tool for the study of public or popular opinion. In public opinion there is a scale of the frequency of moral topics, and this scale seems to vary but slightly from year to year and from place to place. All the rankings are surprisingly uniform, but the rankings about the women are somewhat more uniform than the rankings about the men. This study of public opinion ought to be extended to many different topics, and to different places, times, and classes.
Do these rankings about frequency of behavior give reliable evidence about the actual behavior of these groups of human beings ? This question does not concern the merely statistical measures of reliability, such as the standard error or the probable error. For our figures, these measures of unreliability were very low, seldom over I or 2 per cent. In other words, the statistical reliability of our figures is very high. But this means merely that a repetition of the experiment would give closely similar results. The more fundamental question is whether these human judgments are trustworthy or true. Into the epistemological aspects of this problem it is hardly necessary to go in this article. The question is whether these judgments and rankings can be used as reliable evidence concerning human behavior or conduct. Against such use,
( 268) the argument might be made that these rankings are mere expressions of tradition, and are not based on observation of fact. That might be the case but the evidence runs the other way. Aside from the fact that there is no reason to suppose that there has been a tradition about the frequency of our topics, there are three arguments to show that these rankings are based on observation rather than tradition. In the first place, consider the position of extravagance among women during the war-year 1918-r9. That position, when compared with the higher positions during the following years, would seem to show that the judgments varied with the varying facts. In the second place, it seems improbable that tradition could account for the curve of smoking among women. That seems to be a response to the changing facts. Finally, the figures about the frequency of selfishness among men and among women could not be accounted for on the basis of the traditions in our textbooks about the origin of altruism in the maternal instinct.
No one would argue that tradition may not have had a certain amount of influence on these rankings. But, primarily, these rankings seem to be more or less accurate observations of facts. How accurate they are, it is impossible to say. The question to be asked is not whether these rankings are completely accurate, but whether we have any more accurate evidence. In this connection it is interesting to recall the old controversy between Plato and Aristotle as to the aristocratic versus the democratic theory of judgment. Plato, it will be remembered, held that one superior man, one expert, is a more reliable judge than a group of ordinary persons (Republic 693D, Laws 658E-659B, Symposium 194BC). Aristotle held the contrary view, that "the many judge better . . . . for different people judge different parts and all judge all" (Politics 1281b8-10). My own training had inclined me to favor the Platonic theory that the experts are the best judges. But I have never been able to find two "experts" who can agree
( 270) as much as these group judgments agree. So the group judgments seem to be more reliable evidence than any other evidence that is yet available.
From the point of view of ethics and philosophy, the interest in these frequency scales comes from a comparison of them with the scale of comparative badness. As this scale has been printed and discussed in detail elsewhere, only the coefficients of correlation and certain general conclusions will be given here. There was a negative correlation of .56 between the men's frequency and the men's scale of comparative badness. The corresponding figure for the women was negative .58. In other words, there is a tendency for both sexes to perform more frequently the practices which are considered less bad. But this tendency is about a 50 per cent tendency only. So we are hardly justified in drawing any sweeping conclusions concerning the relations between standards and behavior.
Although the value scale and the frequency scale are different in order, they both have one great similarity. The general statistical characteristics of the scale of value, such as the correlations and the dispersions within each field, are very similar to the corresponding characteristics of the frequency scale. If the argument given above is true, that the scale of frequency is based upon observation of facts, then the similar statistical characteristics of the value scale would tend to prove that the value scale is also based on observation of facts. But this argument can be only touched upon here.
If we ever undertake to study the meaning of value with scientific method, we shall have to use these frequency scales in the process of investigation. The general method will include a set of correlations between the scale of values and various other scales which are supposed to be tests or criteria for value. But no such correlation can be interpreted without a consideration of our frequency scales. For example, consider the theory of value in utilitarianism or universal hedonism.
( 271) It is possible to compare the scale of general value with a scale of comparative amounts of pleasures and displeasures. But in this, as in every test involving consequences, the frequency of each practice must be considered. It is obvious that different frequencies in the practices may involve different magnitudes in the sum-total of the pleasures and displeasures produced. So these frequency scales will be necessary tools in such investigations of value.
Incidental mention may be made of the pedagogical use of such frequency scales as we have been studying. Many persons in the world today have the idea that philosophical ethics consists mainly of concept-juggling and utopian exhortations. Against such ideas there is no more sure remedy than the empirical study of these scales. They arouse the students' interest and activity. They give the teacher a clear insight into the present state of mind of his class. These scales force students and teachers to go from the debating or dialectical method to the investigative method both in describing the facts and in explaining them. Ultimately, these scales may form some small part of the foundations of a truly empirical and scientific ethics.
A. P. BROGAN
UNIVERSITY OF TEXAS