The Phi Gamma Hypothesis
Louis L. Thurstone
University of Chicago
Some time ago I wrote a note calling attention to the fact that the phi-gamma hypothesis is at best an approximation formula and that it is theoretically incorrect. At that time I was not sure whether teachers of psychophysics generally acknowledged this limitation of the phi-gamma hypothesis since I had not seen any explicit statement of its theoretical limitations. As far as I knew the theoretical inaccuracy of the hypothesis might have been considered obvious by psychophysicists generally. Before the note was published I discovered that the theoretical inadequacy of the phi-gamma hypothesis is not generally acknowledged and in consequence I have extended the note into a more complete statement which takes the form of three theorems and several corollaries concerning the psychometric curve and the phi-gamma hypothesis.
The theoretical limitation of the phi-gamma hypothesis consists essentially in the fact that it requires a constant limen for all values of the stimulus. As is well known, the limen for a large stimulus is usually larger than for a small stimulus. Therefore the phi-gamma hypothesis which requires a constant limen is inconsistent with the generally observed fact that the limen is some increasing function of the stimulus. This increasing function is not necessarily that of Weber's law.
It is true that the phi-gamma curve can frequently be used as a good approximate fit for the psychometric curve; but when it is so used it should be thought of not as a psycho-physical hypothesis but rather as any other empirical equation which is used to draw a smooth curve through a set of experimental observations.
In this discussion I limit myself to psychometric experiments which are carried out with only two judgments allowed,
( 294) heavier or lighter, and from which the intermediate category of judgment is barred. There is of course a difference of opinion as to whether the intermediate category should be used in psychophysics, but that is a different story. The present argument concerns the phi-gamma hypothesis for psychometric data obtained with only two categories of judgment.
My propositions concerning the phi-gamma hypothesis are as follows:
Theorem: If the absolute limen increases as the stimulus increases, then the psychometric curve for two categories of judgment is positively skewed.
Corollary: The only condition under which the phi-gamma curve can fit the psychometric curve is that of a constant absolute limen independent of the stimulus magnitude.
Corollary: If the absolute limen increases as the stimulus increases, then the phi-gamma curve, which is symmetrical, cannot fit the psychometric curve, which is skewed.
Corollary: The phi-gamma hypothesis is incompatible with Weber's law. Both cannot apply to the same set of data.
Theorem: If the absolute limen is proportional to the stimulus magnitude (Weber's law), then the positive skewness of the psychometric curve increases with the coarseness of the perceptual process.
Corollary:. The necessary error in fitting the phi-gamma curve to psychometric data increases with the relative limen of the perceptual process. The error of the phi-gamma hypothesis is large for coarse discrimination. It becomes negligible for keen discrimination.
Theorem: If Weber's law is satisfied by the psychometric data, i.e. if the absolute limen is proportional to the stimulus, then the psychometric curve becomes Gaussian when plotted against the logarithm of the stimulus magnitude.
For the sake of completeness we shall first define the terms used in the theorems and their corollaries. The limen has been described as the absolute amount by which a stimulus must be increased in order that the increase shall be notice-able. With the proverbial lifted weights taken as an example,
( 295) the limen for a weight of one hundred grams is the number of grams by which this weight must be increased in order that the increase shall become noticeable. As is well known, the limen is larger for heavy weights than for light.
The above rough description reads as though one experimented with a single weight which is increased in magnitude until the increasing weight becomes noticeably heavier. But that is not the experimental procedure by which the limen is determined. The psychometric function refers to the constant method in which two stimuli, two weights, are presented and the subject decides which of them is the heavier. Hence the limen is described as the absolute difference between two weights which is noticeable.
In order to reduce the term `noticeable' to something measurable, the noticeability is defined usually as that difference between two stimuli which is correctly discriminated in 75% of the attempts. Then the limen is more accurately defined, with reference to the constant method, as that absolute difference between two stimuli which is correctly discriminated in 75% of the attempts.
The two terms standard stimulus and variable stimulus are not infrequently misinterpreted. When the subject is presented with two stimuli, either simultaneously or in succession, his task is to discriminate between them by deciding which is the heavier, larger, or stronger, as the case may be. It should be carefully noted that the subject in his task of discrimination between the two stimuli has absolutely no concern with the distinction between the standard stimulus and the variable stimulus. In other words, this distinction between standard and variable is an arbitrary one introduced later by the experimenter merely for convenience in tabulating and analyzing the records. As far as the subject is concerned, the ideal situation is one in which he is faced with two stimuli and he decides which of them is the stronger.
When every stimulus has been paired with every other stimulus in the series several hundred times, it is possible to tabulate the frequency with which each pair of stimuli is correctly discriminated. The experimenter may then tabu-
( 296) -late in a single column all the pairs in which any particular stimulus A is a member. These records are then said to have stimulus A as a standard. The same thing can of course be done for each of the other stimuli taken in turn as a standard. It is therefore clear that if the judgment "A is greater than B" is returned in (let us say) 82% of the attempts, then this experimental result belongs equally well in the column where A is the standard and in the column where B is the standard. It would of course be possible to set up an experiment with a single standard initial stimulus which is itself made to increase or decrease gradually until the subject indicates that he has recognized the direction of change. Such a set-up would be unusual and it does not involve the phi-gamma hypothesis. It would be a variation of the limiting methods.
The psychometric curve is plotted with one of the stimuli chosen as a standard. The co�rdinates of this curve are as follows. The x-axis represents the variable stimulus magnitude. The y-axis represents the proportion of judgments "Variable stimulus greater than the standard stimulus." It is designated pv>s. Note that the subject had nothing to do with the designation of any one or all of the stimuli as standards. He simply discriminated, as best he could, between pairs of stimuli.
When the variable stimulus is much smaller than the standard, then there will be very few judgments "v > s" because this judgment is incorrect and in the minority. Consequently p v>s will be small, i.e. pv>s < .50. When the variable stimulus is equal to the standard, the judgments of the subject will be equally divided between "v > s" and "v < s" and hence pv>s = pv<s = .50. We are assuming that space and time errors have been eliminated or counterbalanced. When the variable stimulus is much greater than the standard, there will be a majority of correct judgments "v > s" so that pv>s > .50.
The phi-gamma hypothesis states that the psychometric curve is the function described by the integral of the normal probability curve, namely
( 297)
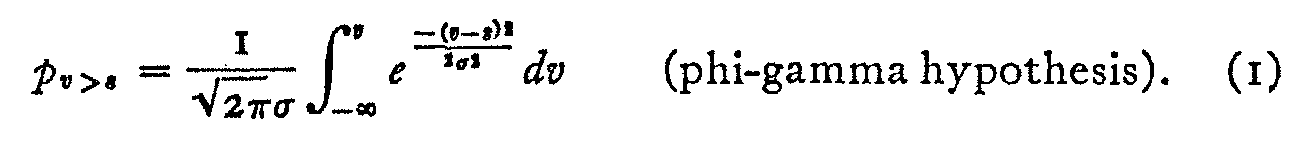
If pv>s is plotted against v we have the well-known ogive for the normal probability curve. The phi-gamma curve φ (γ) is symmetrical about its origin in the sense that the upper and lower quartile points of the ogive are equidistant from the mean. The phi-gamma hypothesis simply states that the psychometric curve can be fitted by the integral of the normal probability curve.
My first theorem merely asserts that if the absolute limen increases with the stimulus, then the psychometric curve for two categories of judgment is positively skewed. This theorem may be proved as follows.
Let there be n stimuli in the experimental series and assume, for simplicity, that they are equally spaced on the stimulus continuum. Let each one of the stimuli be compared with every other stimulus in the series. Let each pair be presented a sufficient number of times to stabilize the proportions pv>s.
From such an experiment it is of course possible to tabulate the proportion
of judgments "A is greater than
B" for every possible pair of stimuli in the series. There will be n(n
- i) proportions in such a table. It is obvious that, since the subject is
allowed only two categories of judgment, the proportion of judgments "A
is greater than B" must necessarily be the complement of the
proportion of judgments" B is greater than A."
In other words,
pa>b + pb>a = 1
Now let us collect all the proportions in which the stimulus R2 is involved in order to plot the psychometric curve with that stimulus as a standard. It is represented in curve A of Figure i. Let the experimental proportion
P1>2 = .25.
Then the lower quartile point for the curve A is RI and its median is R2. Now, by the φ (γ) hypothesis, the curve is symmetrical and therefore the upper and lower quartile
( 298) points are equidistant from the median. But the stimuli are also equally spaced. Therefore the upper quartile point of curve A must be R3. In other words,
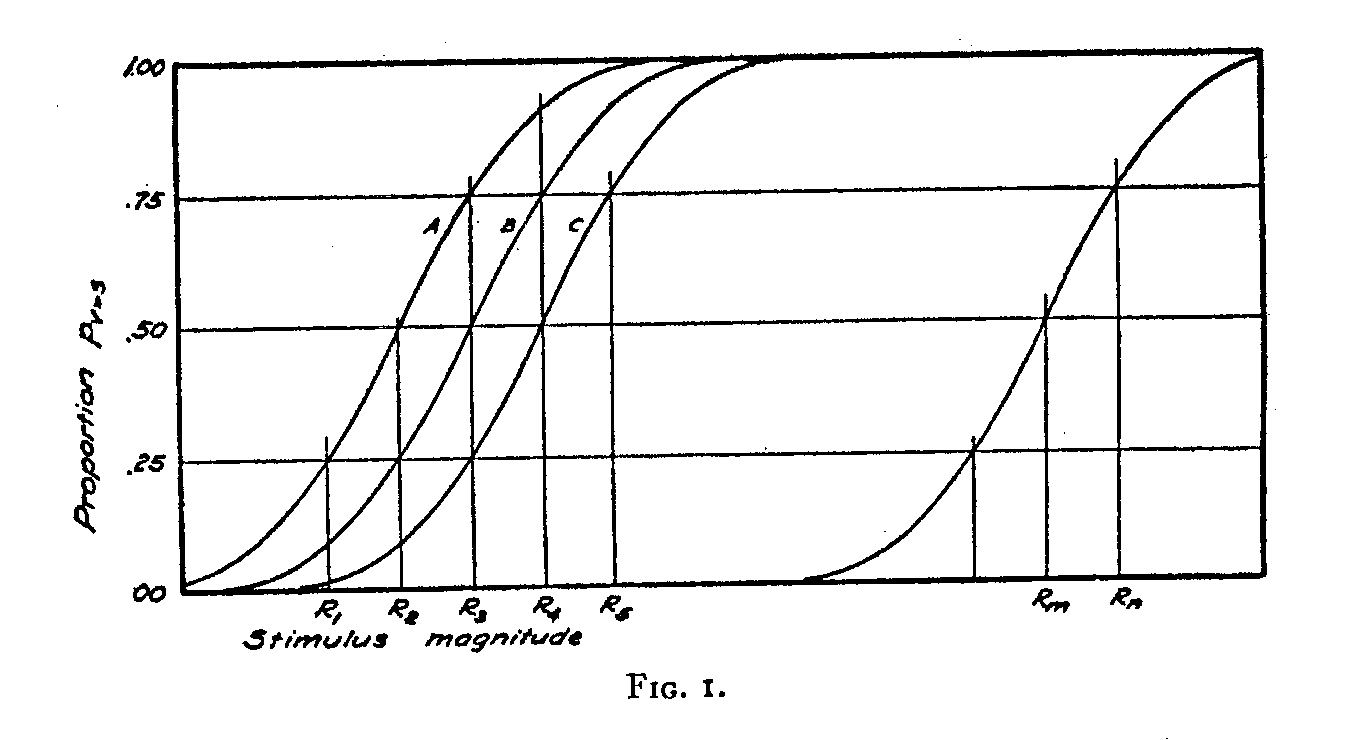
R3—R2= R2 —R1,
R2 = median of
curve A,
RI = lower
quartile of A,
R3 = upper quartile of
A.
Therefore
p3>2 = .75.
But then, by (2)
p2>3 = .25,
and this locates the median and the lower quartile for curve B, in which R3 is the standard. In other words,
R4—R3= R3—R2,
R3
= median of curve B,
R2 =
lower quartile of B,
R4 =
upper quartile of B.
This can be continued indefinitely so that
Rn — Rm = R2— RI(3)
and
pn>m = p2>I,(4)
where Rn is a large stimulus and R2 is a small one.
( 299)
But we have postulated that the absolute limen increases with the stimulus magnitude. Hence the two stimulus increments (Rn — Rm) and (R2— RI) which are equally often correctly discriminated must be such that
(Rn — Rm) > (R2— RI)(5)
and hence the psychometric curve must be positively skewed rather than symmetrical. This is the first theorem. It does not postulate Weber's law. It merely postulates that the limen is an increasing function of the stimulus.
The first corollary is seen in Figure 1, in which the symmetry of the psychometric curve is postulated. It leads to equations 3 and 4 as the only condition under which the psychometric curve can be symmetrical.
The second corollary makes the necessary inference that if the absolute limen is an increasing function of the stimulus then the symmetrical phi-gamma curve cannot fit the psycho-metric curve which is positively skewed. This does not depend on Weber's law.
The third corollary introduces Weber's law. Weber's law states that the difficulty of discriminating between two stimuli is a function of the ratio of their magnitudes. The difficulty of discrimination is measured in terms of the relative frequency of correct discrimination. The law can be stated in algebraic notation as follows : [1]
pR>KR = C.(6)
If the constant C is arbitrarily set at .75, then the constant K represents the relative limen while R is the higher of the two compared stimuli. The relative limen constant is here less than unity. The same equation may be written
pR<KR = 1 — C.(7)
If it is desired to use the notation R' for the lower of the two stimuli, then the law takes the equivalent form
pR�>KR� = C
where
l = i/k > 1,
( 300)
and this can of course be turned into the complementary form
pR�<KR� = I — C.
Weber's law asserts that the limen is proportional to the stimulus while the phi-gamma hypothesis requires that the limen be constant. Both cannot be true of the same set of data.
The second theorem is that if the absolute limen is proportional to the stimulus (Weber's law), then the positive skewness of the psychometric curve increases with the coarseness of the perceptual process. This theorem and its corollary regarding the necessary discrepancy between the symmetrical phi-gamma curve and the positively skewed psychometric curve can be shown perhaps best by several examples of different degrees of keenness of discrimination.
The psychometric curves in Figures 2, 3, and 4 are drawn
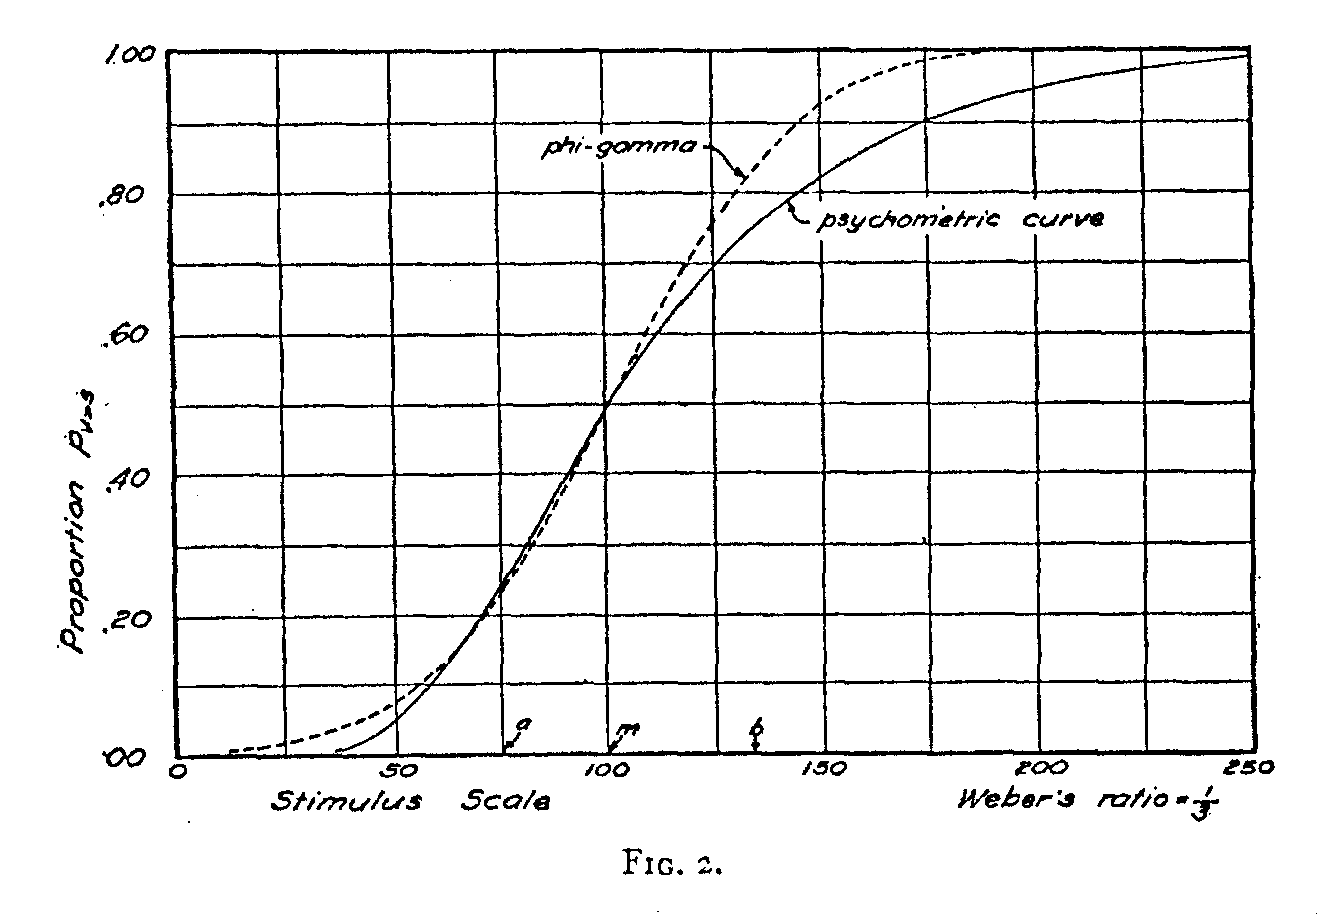
with the supposition that Weber's law holds in the vicinity of the magnitude of the standard stimulus. We do not need to assume that Weber's law holds for extremely large or for extremely small stimuli in order to draw these three psycho-metric curves. We shall designate the magnitude of the
( 301) standard stimulus arbitrarily as 100 and we shall assume that Weber's law holds in the vicinity of this magnitude in order that a comparison may be made between the phi-gamma curve and the psychometric curve.
In Figure 2 we have taken Weber's ratio as 1/3 which represents coarse discrimination, such as for loudness of sound.
(302)
With the coarseness of discrimination represented by this ratio we shall expect two stimuli of magnitudes 100 and 133 to be correctly discriminated in 75% of the attempts. This is represented graphically by the fact that the psychometric curve of Fig. 2 reaches the level .75 when the variable stimulus is 133 and the standard stimulus is 100. Since Weber's ratio is here assumed to be 1/3, we shall expect the same frequency of correct discrimination, namely 75%, for two stimuli 75 and 100 since they have the same ratio as the two stimuli 100 and 133. The psychometric curve shows that the proportion p75>100 has the value .25 so that p100>75 = .75. The psycho-metric curve has been drawn to represent the fact that it is as difficult to discriminate between two stimuli of 75 and 100 as it is to discriminate between two stimuli of 10o and 133 since these two pairs of stimuli have the same ratio. This is the condition described by Weber's law when the ratio is 1/3.
But it is immediately clear that this psychometric curve cannot possibly be symmetrical because
133 — 100 <>100 — 75
and consequently the curve cannot be Gaussian. The dotted line of Fig. 2 represents a phi-gamma curve which has been so drawn that it passes through the median and the lower quartile of the psychometric curve. If the phi-gamma curve must be fitted to the psychometric curve in this instance it can be moved to the right or left, and its standard deviation can be altered; but it cannot possibly be made to fit the psychometric curve which is clearly non-symmetrical.
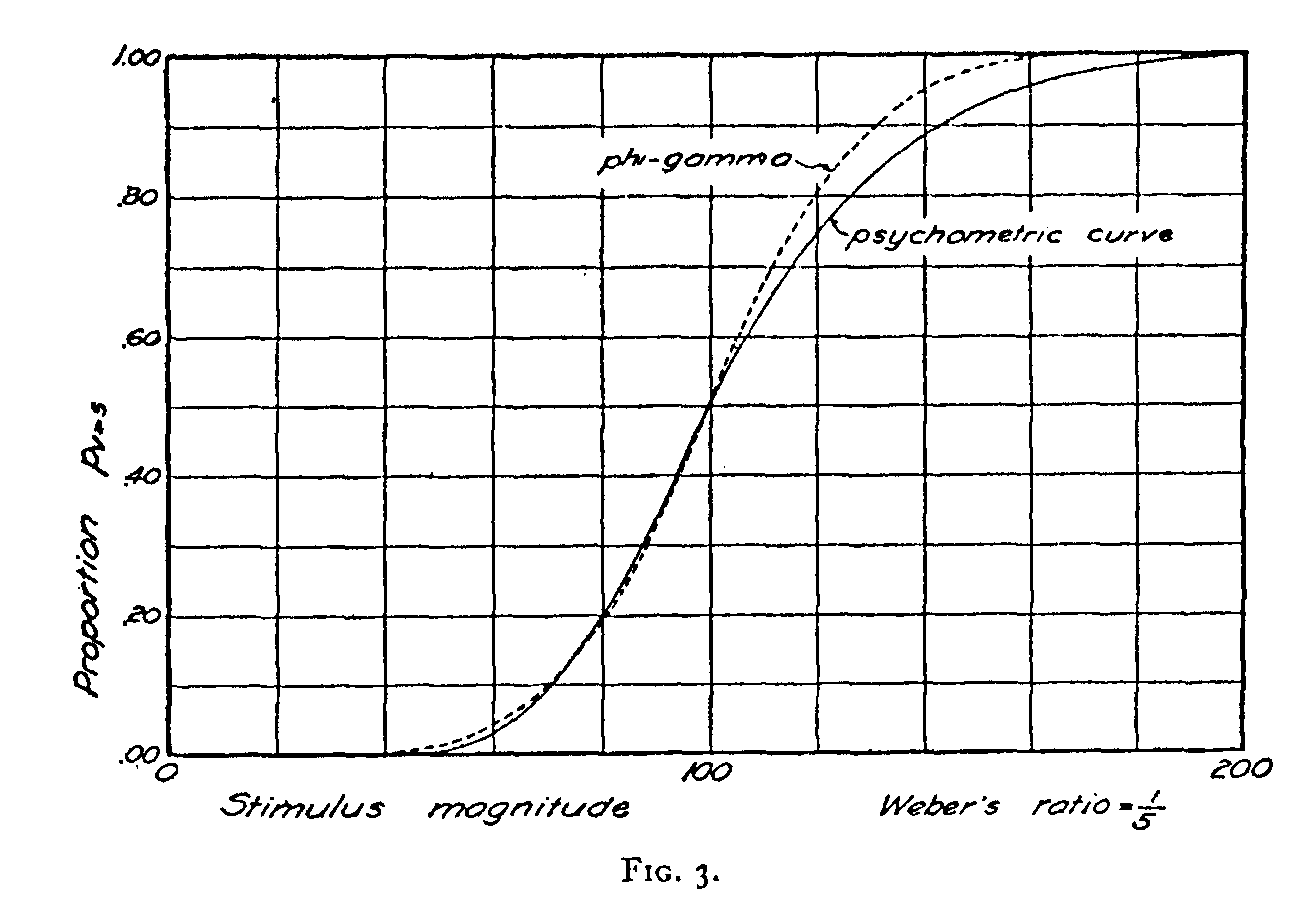
In Fig. 3 we have drawn two curves in the same manner as in Fig. 2 except that here we have assumed Weber's ratio to be only 1/5. In other words, this figure represents a keener discriminatory function than the previous figure. Here, again, we are assuming that Weber's law holds in the vicinity of the standard stimulus value of 100. The psychometric curve is so drawn that the two stimuli of 100 and 120 are correctly discriminated in 75% of the attempts and also that the two stimuli 83.3 and 100 are as often correctly discriminated. The psychometric curve is here also non-symmetrical, since
120 - 100<>100 - 83.3,
( 303) although the degree of assymetry is not so pronounced. The discrepancy between the phi-gamma curve and the psychometric curve is smaller than in the preceding figure where Weber's ratio was assumed to be larger.
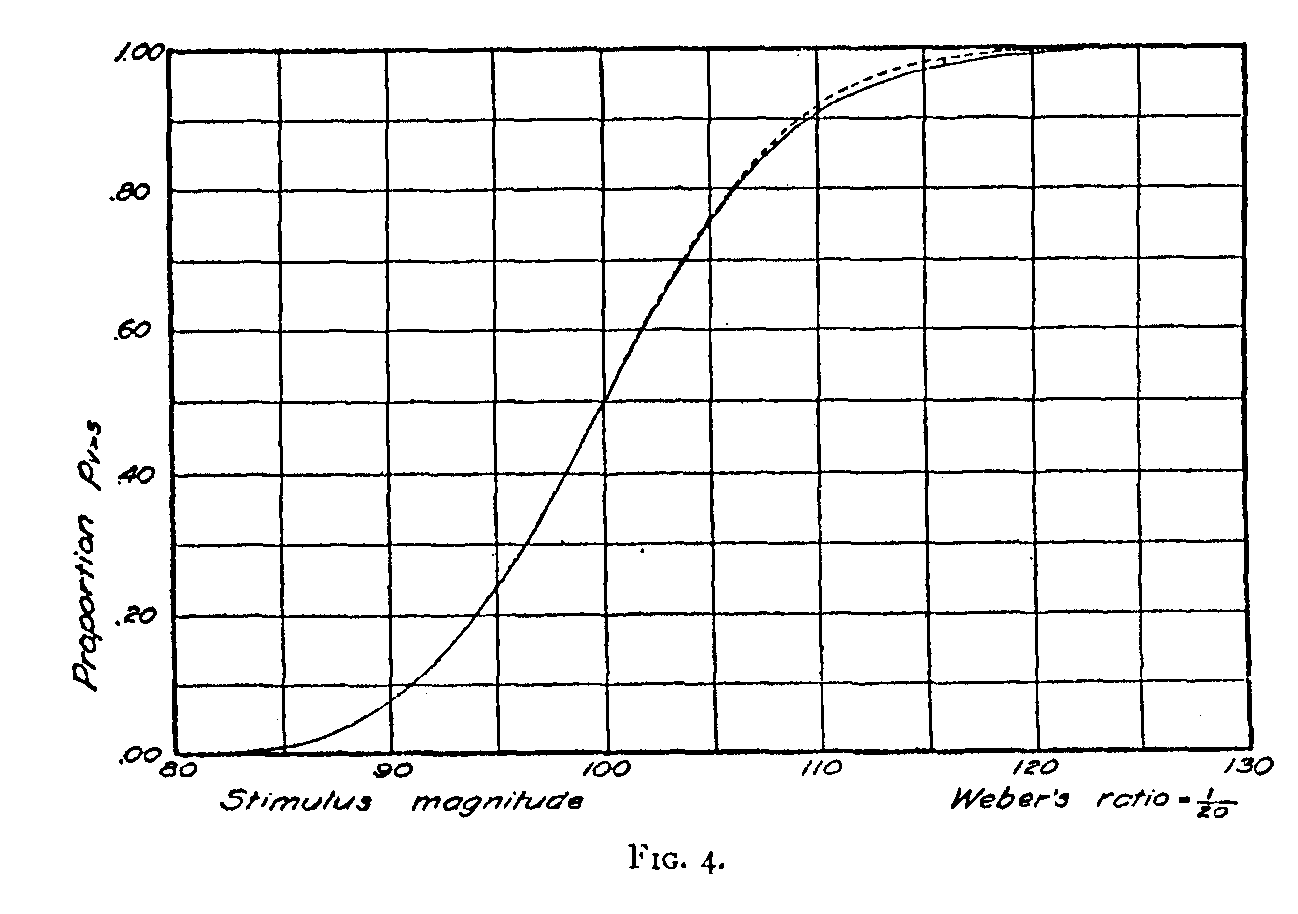
In Fig. 4 we have the same type of diagram for a perceptual function in which Weber's ratio is much smaller, namely 1/2o. In other words, when the difference between two stimuli is 5%of the smaller one, the frequency of correct discrimination is expected to be 75%.It will be seen in Fig. 4 that the discrepancy between the psychometric curve and the phi-gamma curve is relatively small since the discrepancy
105 — 100<>100 — 95.2
is much smaller than in the previous examples.
Finally, when Weber's ratio is only one or two per cent, as in the perception of visual brightness, then the discrepancy is so small that the phi-gamma curve can be used to advantage in fitting the psychometric curve. It is of some interest, however, to know that the phi-gamma curve is theoretically incorrect, that it cannot possibly be the correct function for the psychometric curve, and that its usefulness is merely that of an empirical equation or curve. It serves the purposes of a scroll, as it were, in drawing a smooth curve for the psycho-metric data with an error that is very small, perhaps smaller than the observational errors, when the perceptual function which is being studied is keen.
The fact that the fallacious character of the phi-gamma hypothesis has not previously caused trouble is to be found in the fact that most of the perceptual functions that have been investigated have been rather keen. Examples of these are the perception of visual brightness and of line-lengths. In cases of coarse discrimination such as that of sound intensity there has been the uncertainty of stimulus measurement which introduces another ambiguity into the handling of psycho-metric data. When the perceptual function is rather coarse, it is necessary to take into consideration the error of the phi-gamma hypothesis.
The third theorem is that if Weber's law is satisfied by the
(
304) psychometric data, then a φ(log γ) hypothesis will also be satisfied by
the same data. If we want an empirical equation for the psychometric function
which shall be at least not theoretically inconsistent with Weber's law, then we
may propose as a substitute for the φ(γ) hypothesis a φ(log γ) hypothesis. The
integral of the normal curve would then be fitted on a psychometric function in
which the proportions pv>s
are plotted against the logarithm of the stimulus intensity. Even if Weber's
law is not exactly verified by the data it is in the great majority of
experiments more nearly true to assume that the limen is proportional to the
stimulus than to say that the limen is constant and independent of the stimulus
magnitude. The latter assumption of the phi-gamma hypothesis flies in the face
of the simplest experimental evidence.
Let the points a and b of Figure 2 be the base line values
corresponding to the ordinates .25 and .75 respectively of the psychometric
function. If the empirical equation used in fitting the psychometric function is
to be symmetrical, then
b — m=m— a.(8)
Let
a = log Ra,
b = log Rb,
m = log Rm.
Then, by (8)
log Rb —log Rm = log Rm —log Ra
or
log(Rb / Rm) = log (Rm / Ra)
which is the condition required by Weber's law.
This manner of fitting the psychometric function is at least consistent with Weber's law and it may be called the φ(log γ) hypothesis as a substitute for φ(γ) hypothesis. It should be regarded merely as an empirical equation for determining the limen and the precision. It should not be taken too seriously either in the form φ(γ) or in the form φ(log γ).
( 305)
The actual fitting of the curve may be accomplished graphically to a fair degree of accuracy by means of arithmetic-probability cross-section paper, or it may be done by plotting the sigma value corresponding to the experimental proportion against the logarithm of the stimulus magnitude. The plot should be linear. A constant error will be revealed by the intercept, and the slope of the linear plot will be the precision. The function can also be fitted by the method described by Kelley,[2] with this difference; the logarithm of the stimulus should be used instead of the stimulus magnitude. The system of weighting which is ordinarily used need not be modified because the weight is a function of the observed proportions which are retained as before. Urban's tables and Rich's checking tables are unfortunately not ordinarily applicable to this modification of the phi-gamma hypothesis because these tables presuppose that the stimulus magnitudes are equidistant. They would be applicable if the experiments were so set up that the logarithms of the stimulus magnitudes should constitute an arithmetical series.
It should be noted that my main criticism of the phi-gamma hypothesis is not contingent on the acceptance of Weber's law. The phi-gamma hypothesis is denied if the absolute limen increases with the stimulus magnitude even if Weber's law is not exactly verified.
(Manuscript received Jan. 5, 1928)