A Method of Scaling Psychological and Educational Tests
Louis L. Thurstone
University of Chicago
The idea for the method of scaling tests which I am about to de describe occurred to me while trying to tease out the logic of some of the well-known educational scales and mental age scales. The authors of educational scale monographs seldom give an adequate discussion of the assumptions and of the logic of their settle constructions. Of course, it is not to be expected that any one method of scaling will apply to all types of educational and psychological test material, and I am not attempting to offer it single solution for all scaling problems.
My present method applies especially to test items that can be graded right or wrong, and for which separate norms are to be constructed for successive age- or grade-groups. By slight modification it is also applicable to tests that give a numerical score. The method is, therefore, applicable to such test material as the Binet test questions. It is also. applicable to educational test material such as arithmetic problems or spelling, and to other types of content in which answers can be definitely graded as right or wrong and for which we want separate tabulations for children of successive ages or of successive grades.
In order to explain the method I shall follow through an example with the Binet test questions. The method is by no means limited to mental ago data, but the explanation of the method will perhaps be clearer if I explain it consistently with one type of material as an example. For the actual data I have selected the tables prepared by Burt (I) from his Binet test results on 3000 London school children
The first part of the analysis will be similar to the methods already in general use. In Fig. I we have a frequency surface. Let it repre-
( 434) -sent the distribution of Binet test intelligence for seven-year-old children. It is a normal surface, and this is about the only assumption that we shall make. It has been shown by Jaederholm (2) and others to be a reasonable assumption.
Those children who are represented toward the right end of the surface in Fig. I. are bright for their age, while those toward the left side are below the average of their age. Evidently the average intelligence of seven-year-old children would be represented by the point d on the scale since that point is at the mean of the distribution. But the brightness of these children is judged by their answers to a lot of questions which are more or less roughly graded according to difficulty in the mental-age scales. We shall therefore locate these test questions on the scale as landmarks of different levels of intellectual growth. These questions, when so located on the scale, will serve
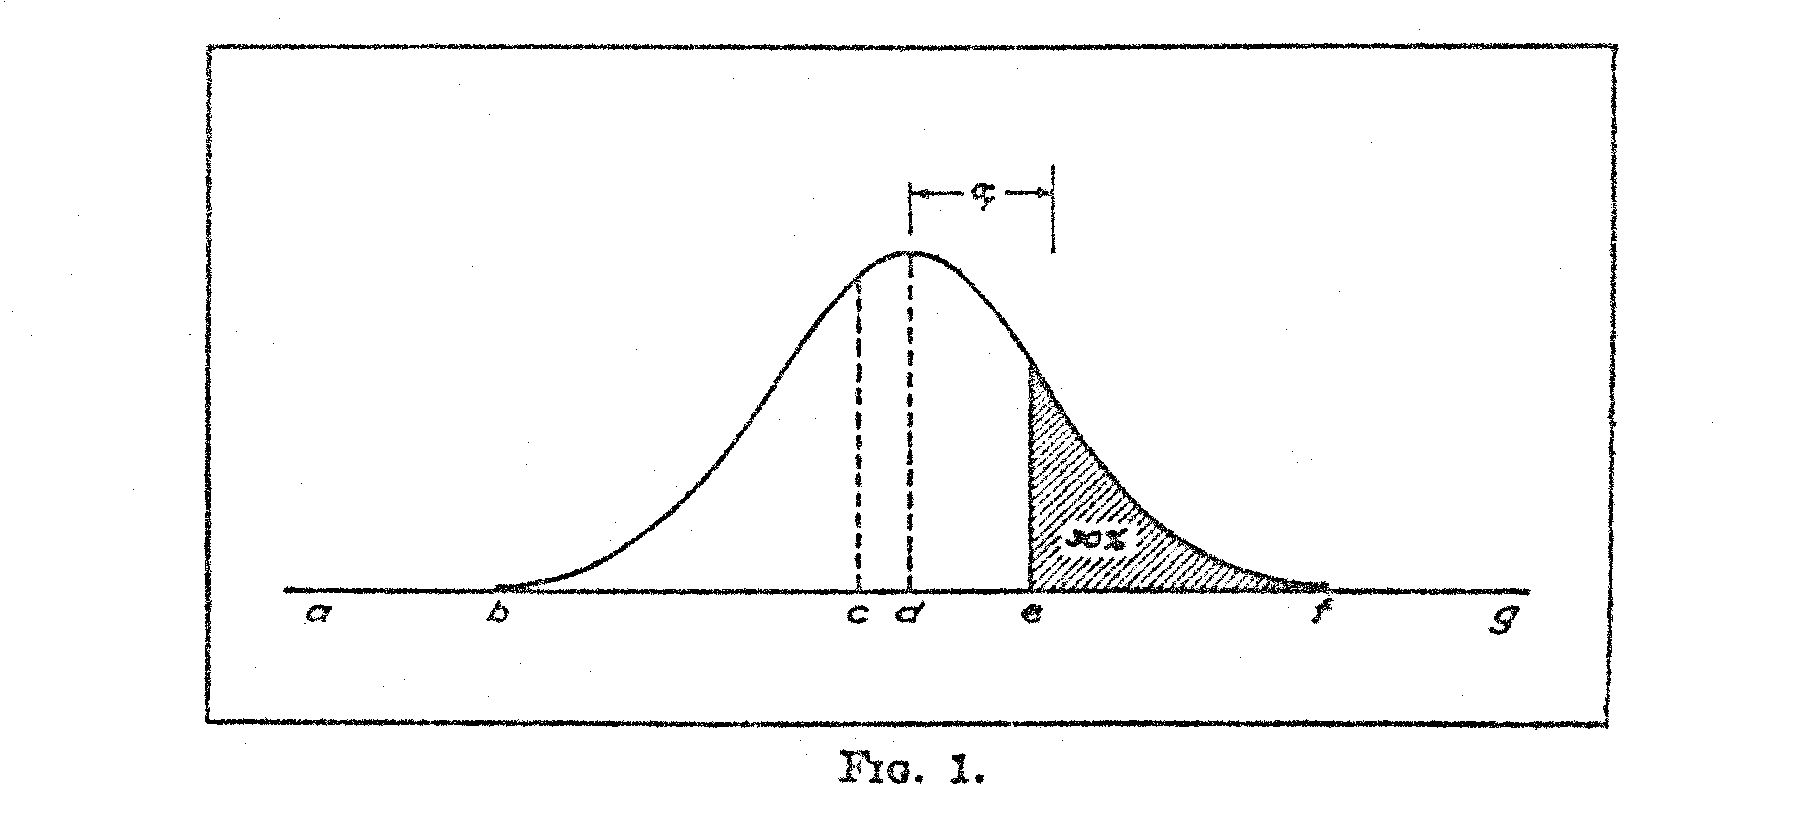
our purpose in arriving at a numerical measurement of scale distances. Let us assume that a particular test question has been located at the point d on the scale. This means that 50 per cent of the seven-year-old children answered it correctly. It is clearly an average question for that age since half of the children. get it and half of them fail on it. Its difficulty represents the mid-point of the distribution of test intelligence for children. of; this age. This percentage rating of the test question corresponds to the fact that one-half of the surface is to the right of the point d. If this is our basis of locating the test questions on the scale, it is clear that the difficult questions will be located toward the right of the mid-point, and that the easier questions will be located toward the left of that point. Consider, for example the question which has been located at the point e. It is one of the more
(435) difficult questions. It in correctly answered by only 30 per cent of the seven-year-old children and it is therefore located at such a point on the base line that 30 per cent of the whole surface is to the right of
If we imagine a slightly older group of children whose mental growth has advanced a little beyond that of the seven-year-old children, we could imagine the average of thin older group of children to be at the point n. They might have 50 per rent right answers (or the question which we located at n on the scale for the seven-year-old children. It is clear that the distributions of test-intelligence for older children will move toward the right, and that the distributions for the younger children will, of course, be nearer the left. Now suppose that we find a test question which more than half of the seven-year-old children can answer correctly. Evidently it should be located at a point below the average for the children of thin age. Such a question is shown at the point c. It is evident that the average seven-year-old child is one who in exceeded by 50 per cent of children of his own age and who exceeds 50 per cent of children of his own age. In other words, an average child in one who is at the middle of the distribution of intelligence for children of his ago. Now, if a question in answered correctly by 00 per cent of seven-year-old children, such a question should be located below the average of that age group.
Let us now consider a test question which is answered correctly by 100 per cent of the seven-year-old children. It is so easy that all the children in this ago group have passed it; the whole distribution is to the right of that question. The question, then, should be located at a point such as b, or still farther back such as the point a. In filet, if a test question in answered correctly by 100 per cent of a certain age group, we cannot locate the point definitely on the scale. All we know about it is that it is somewhere to the left, beyond the distribution.
The same reasoning applies to a test question which is so difficult that none of the seven-year-old children can answer it correctly. Such a question marks a point on the scale so far ahead that the distribution of intelligence of seven-year-old children has not yet covered it. Such a point might be at f or still farther on at the point g. When we find this type of question, we may expect that an older age group, with its distribution of intelligence farther toward the right on the scale, will give a higher percentage of right answers and the question can then be definitely located on the scale. We see, therefore, that a question cannot be definitely assigned to a point on the scale if it is
( 436) either so difficult that none of the children in a given age group can answer it or so easy that they can all give the correct answer. The percentages of right answers must be above 0 and below 100.
We can now summarize the procedure so far covered. We assume the distribution of intelligence of children of any given age group to be approximately normal. Since test-intelligence is indicated by the correctness of answers to test questions, it is legitimate to designate the points on the scale of test-intelligence by means of the questions as landmarks. Each test question is located at a point on the scale so chosen that the percentage of the distribution to the right of that point is equal to the percentage of right answers to the test question for children of the specified age.
In order to facilitate the handling of such data, we give a numerical value to each test question for each age with the standard deviation of the distribution as a unit of measurement. All test questions that are located above the average of the group have positive values, while all test questions that are located below the average of the group have negative values. Thus a test question which has a numerical value of +1.σfor seven-year-old children is answered correctly by about one-sixth of the children of that age. But its value for the next higher age group would, of course, be lower, because more of the eight-year-old children would answer it correctly We shall therefore designate numerically each test question for each age group. The numerical designation will be different for each age group because the distribution of intelligence moves to the right on the scale with increase in age.
Now, what we want is a series of frequency curves, all drawn on the same base line, that will truly represent the distributions of test-intelligence of children of successive chronological ages. On this base line we shall, locate each of the test questions. The curves must be so drawn that no matter where a test question is located on this base line the proportion of any given age distribution to the right' of that question will correspond to the actually observed percentage of children of that age group who answer the question correctly.
In order to draw a series of curves to represent the distributions of test-intelligence of children of successive ages. we can draw the first one anywhere on our scale irrespective of the units or the origin. Our problem is then to draw the others on the same scale in such a way that their interrelations shall correspond with the actually observed percentages of right answers.
( 437)
There are two facts that must be established for each curve before it van be drawn, namely its mean and its standard deviation. It does not matter at all where we locate the origin or zero. Let us arbitrarily locate it at the mean of the lowest age group that we are dealing with It can later be shifted to any convenient place. Similarly, it does not matter what unit of measurement we use for the base line. Let us for convenience adopt as the unit of measurement the standard deviation of the lowest age group in any particular study. It can also be shifted later to any convenient scale.
In Fig. 2 let the frequency curve A represent the distribution of test ability for children of any specified age. Let the curve B represent the distribution for an older age group. The base line represents
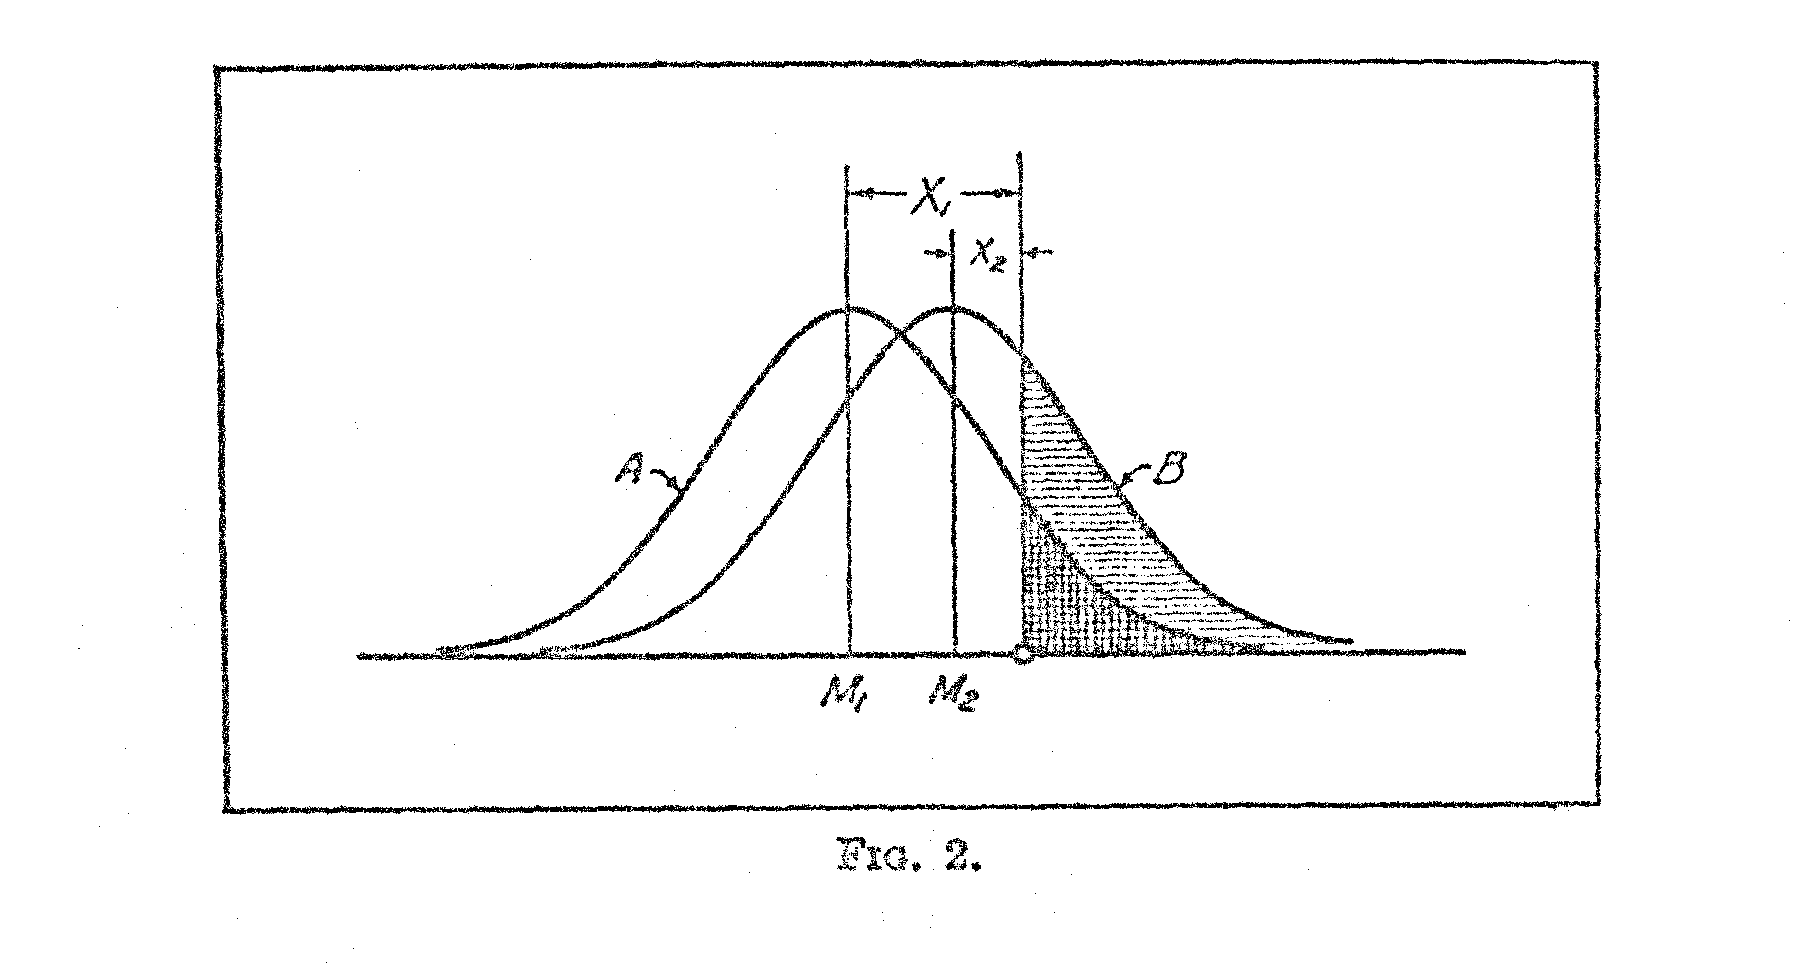
achievement, or relative difficulty of test questions, while the ordinates represent relative frequencies of children at each degree of achievement. The means of the two distributions are designated M1 and M2, respectively. Naturally we should expect the higher age group to have a higher mean on the scale and, therefore, the two curves are so drawn that the mean M2 is higher than the mean M1.
Let the small circle represent any particular test question. The shaded area in the B surface represents the proportion of. the older age group who can answer the question correctly. The remaining unshaded part of the distribution represents the proportion who fail on that question. The same reasoning applies to the. A distribution. There is a larger proportion of the older children who can answer the question, and that is reasonable because B represents children older than A.
( 437)
If we know the percentage of children of different ages who can answer each question, it is possible to locate the questions on an absolute scale, and it is also possible to locate the means of the successsive age groups on the same absolute scale, and to determine the standard deviations of the successive ages on the same scale. The present method assumes that the distribution of abilities is normal, but it does not assume that the standard deviations of the successive age or grade groups are the same.
Let XI represent the deviation from the mean, M1, of a particular question for children of a particular age. This is determined in the usual way from the percentage of these children who can answer the
question correctly. Of course, X1 is measured in terms of the standard deviation, σ1, of the distribution. In the same manner, let Xi represent the deviation from the mean, M1, of the same question for an older age group. It is, of course, expressed in terms of the standard deviation, σ1, of its own distribution.
It is clear in Fig. 2 that M1 plus X1 σ1 must be equal to M2 plus X2 σ2 because they are measurements to the same point on the scale, both measurements representing the same test question by two different age groups. Hence,
M1 + X1 σ1 = M2 + X2 σ2 (1)
(439)
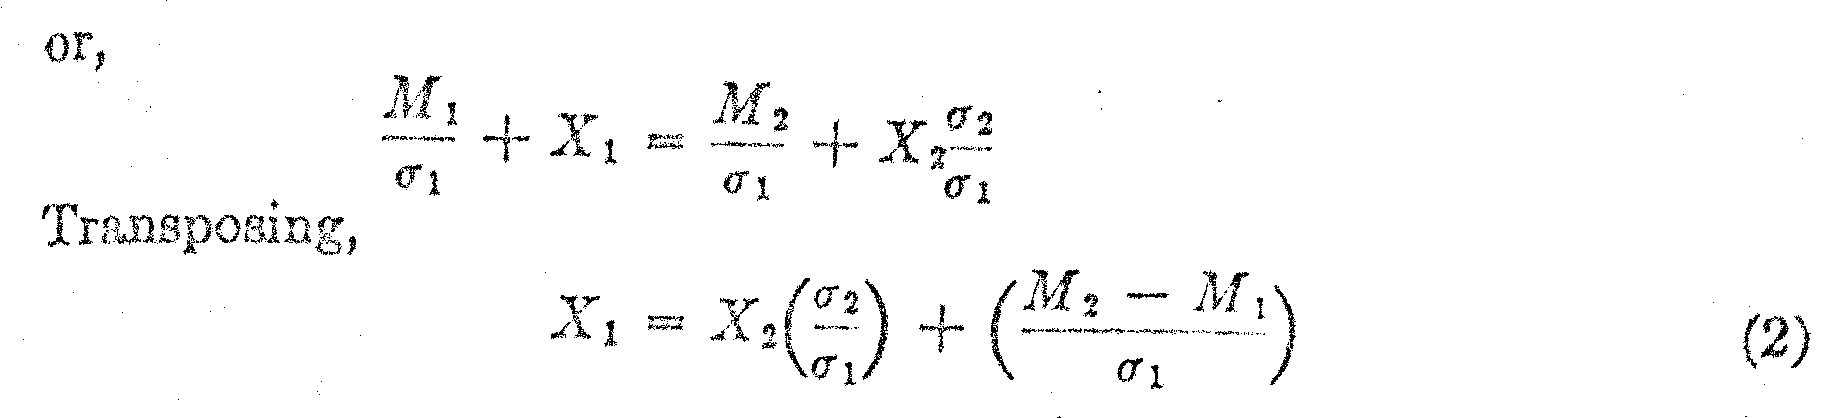
This equation is linear if we plot the observed values of X1 against the corresponding values of X2 for the same test questions. The constants will be as follows:
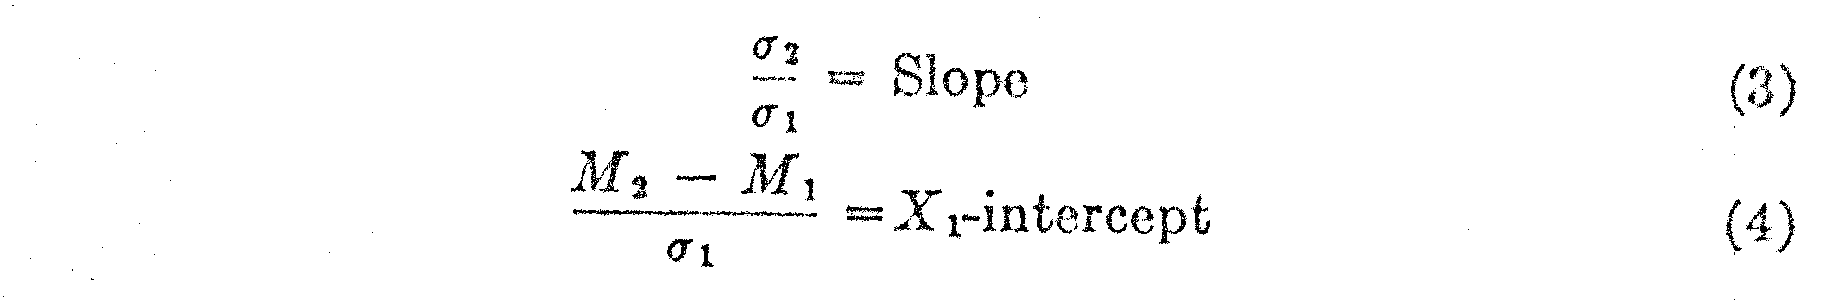
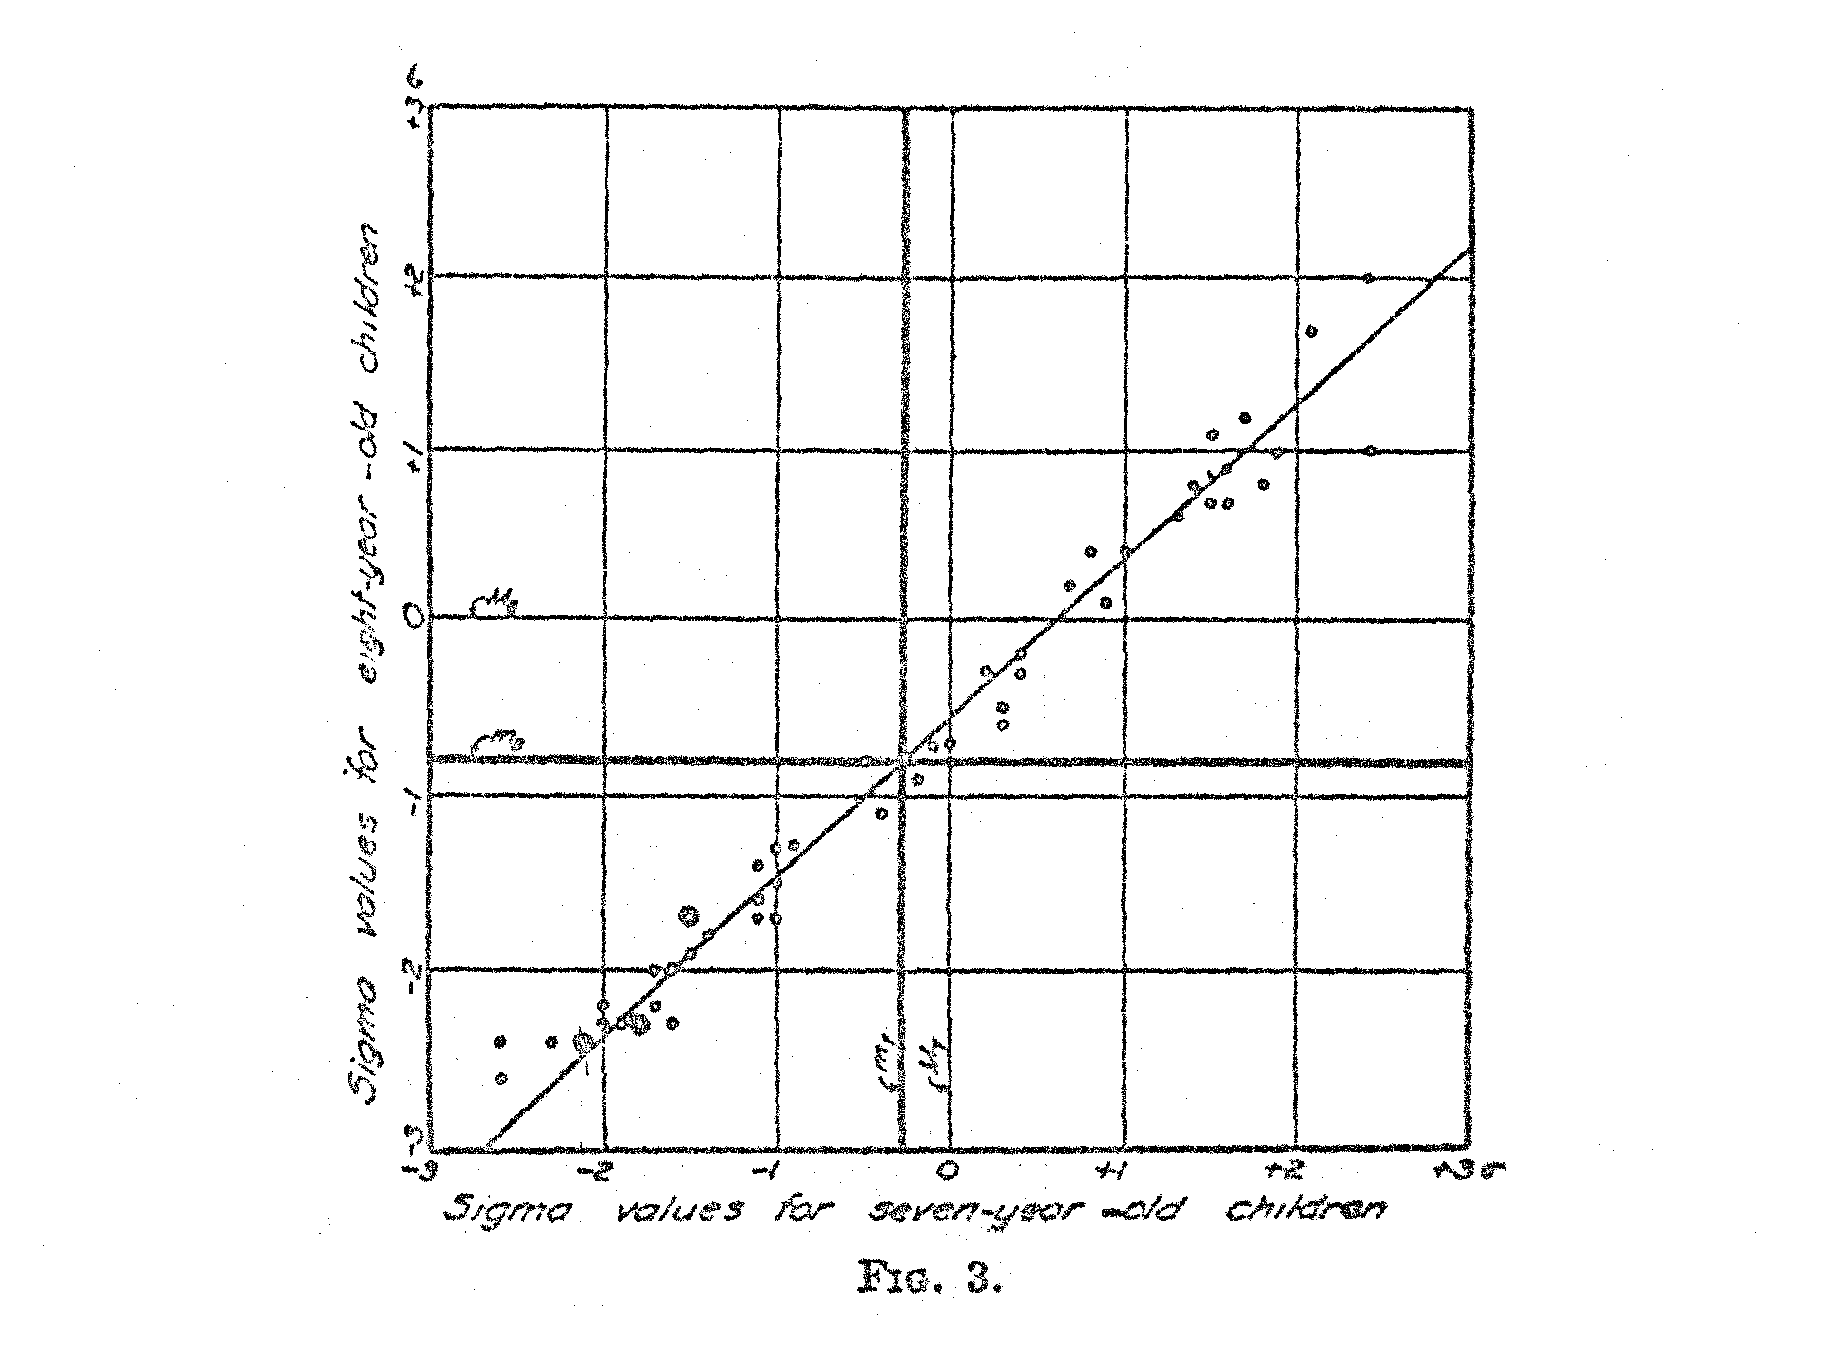
In Fig. 3 the paired values of X1 and X2 have been plotted for two adjacent age groups and it is immediately apparent that the relation is linear. The two mean lines for X1and X2 are determined from the following relations,
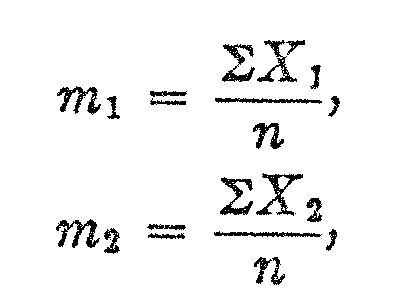
in which m1 is the average of the observed X-values for the lower age group, and m2 is, similarly, the average of the observed X-values for the upper age group, and n is the number of overlapping test questions for the two age groups. It should be noted that m in this notation represents the average of all the X-values in the data whereas M represents the mean of the distribution on the absolute scale.
The next step in the calculation is to determine the numerical values of the constants of the line in Fig. 3 because these two constants will enable us to draw the two distributions on the same base line. Let the deviations from m1 and m2 be defined as follows:
x1 = X1 � m1
x2 = X2 � m2

Then the line of relation, assuming r = 1., is as follows:
x1 = (s1/s2)x2
( 440)
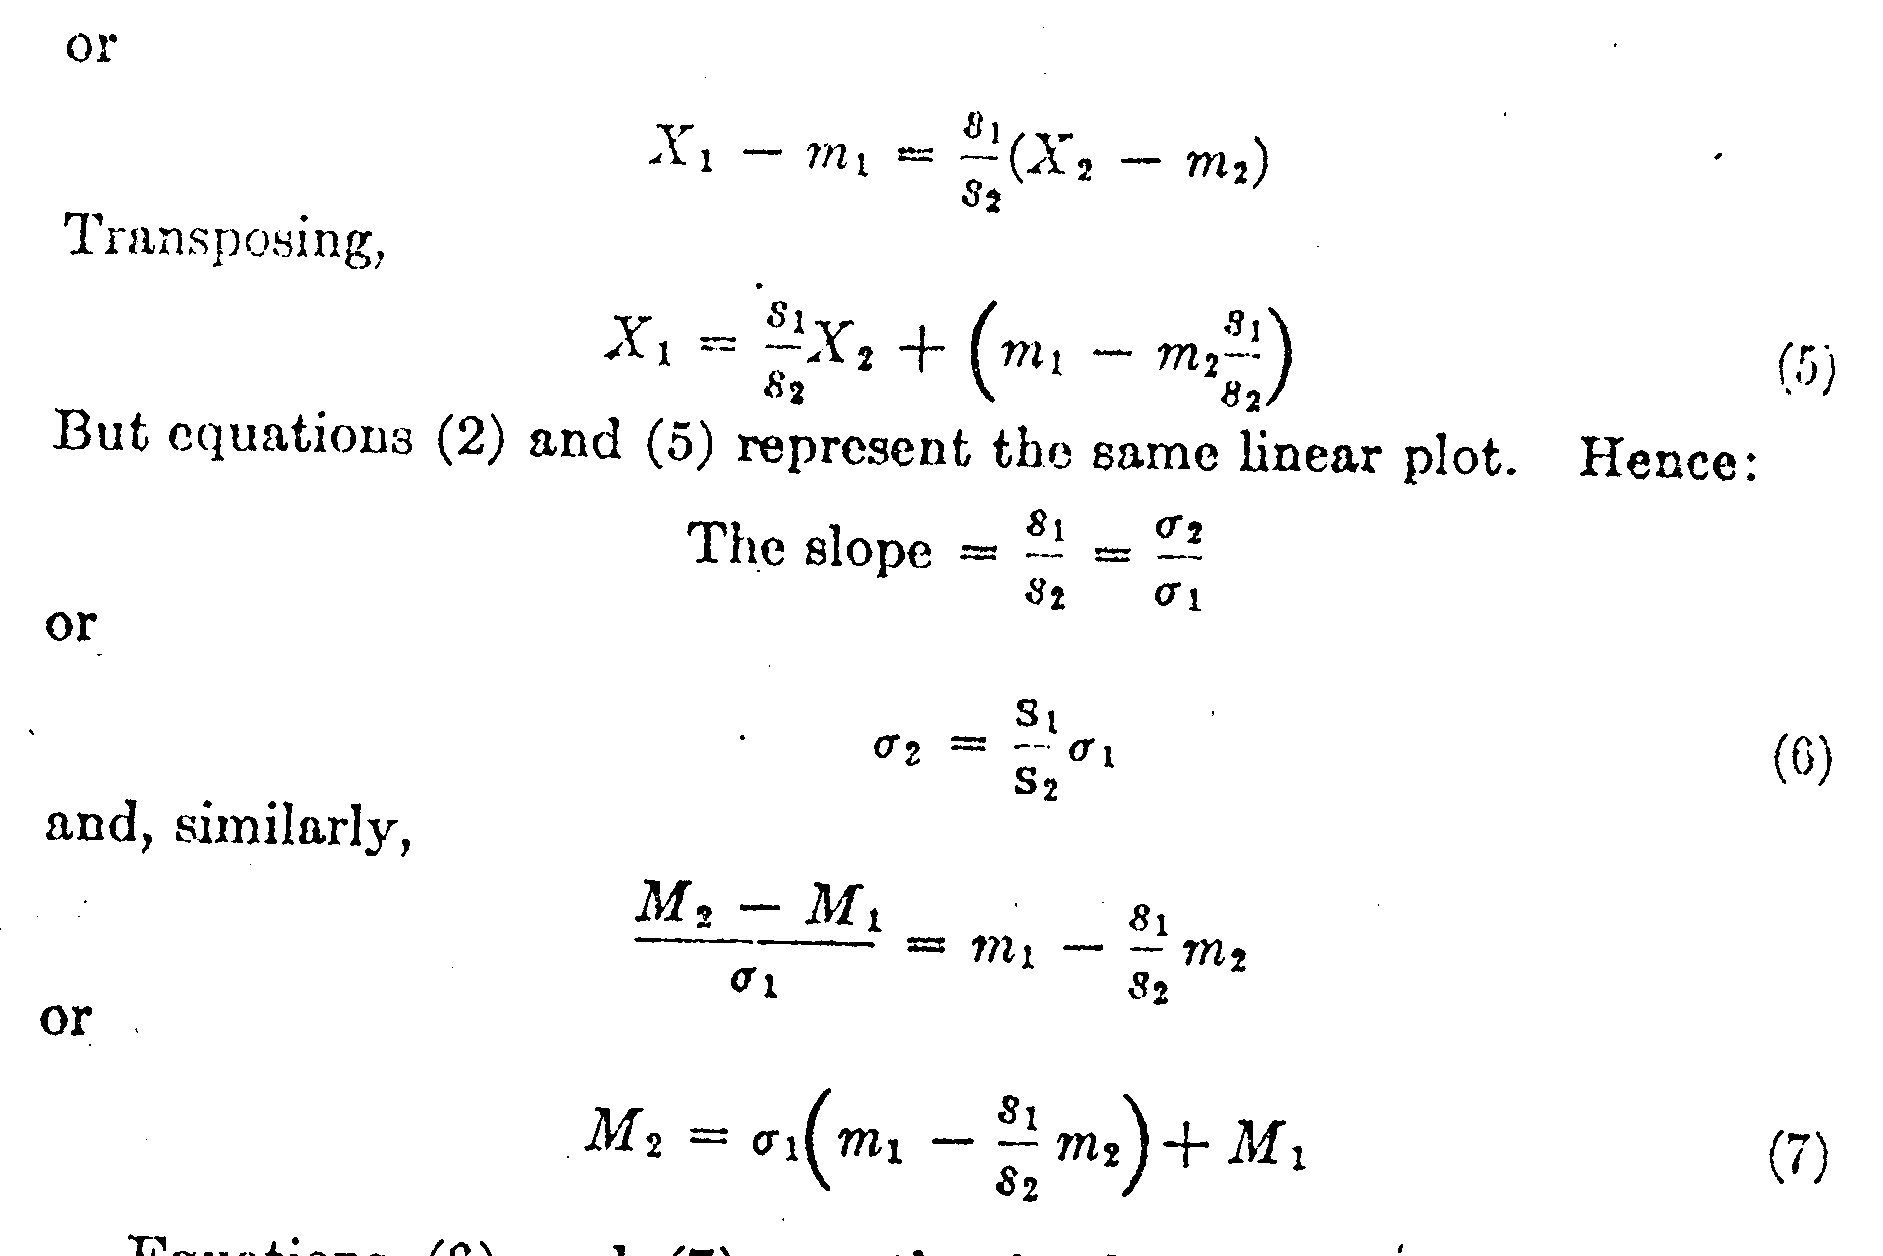
Equations (6) and (7) are the fundamental equations for our scaling purposes. By means of equation (6) we can ascertain the standard deviation of one age distribution when the other is assumed or known, and by means of equation (7) we can locate the mean of one of the age distributions when the other is assumed or known. These two formulas should prove quite generally useful in scaling tests.
Let us assume an arbitrary origin at the mean of the distribution for three-and-one-half-year-old children in Burt's data, and let us assume as our unit of 'measurement on the absolute scale the standard deviation of the same age group. The scaling can later be changed into any desired unit of measurement and it can be easily adjusted to any desired origin.
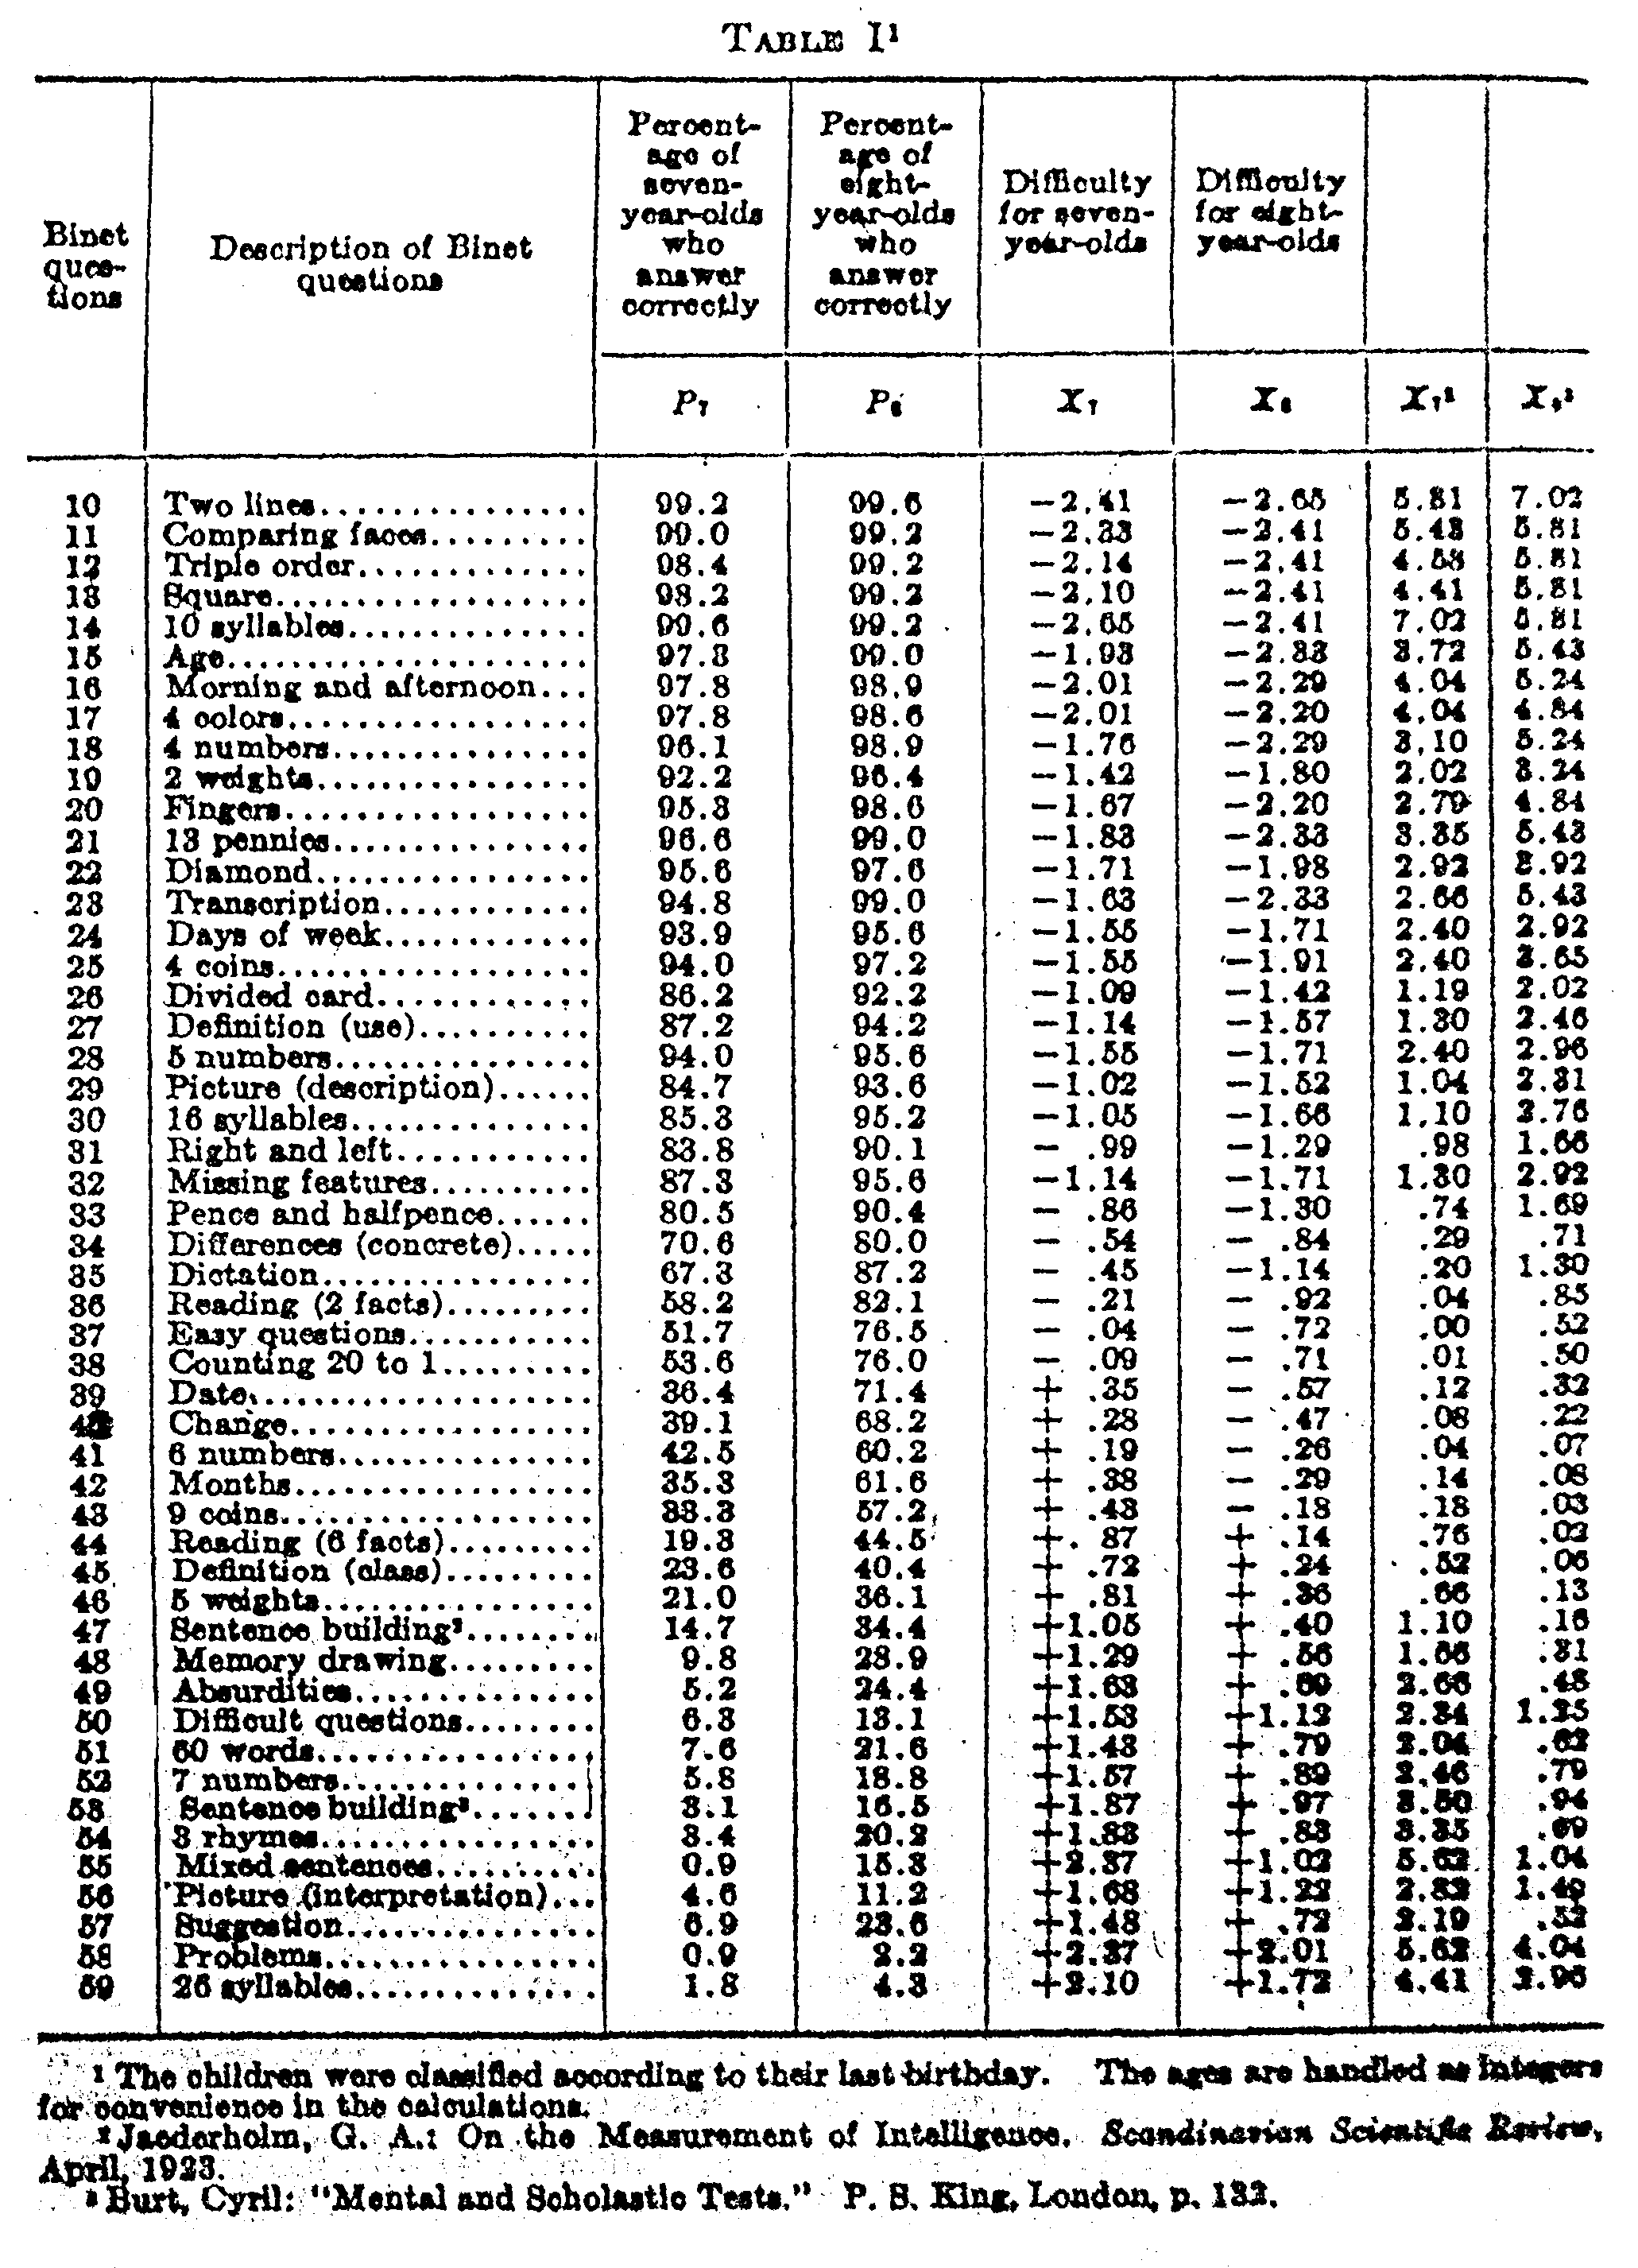
In Table I we have the data from Burt for seven- and eight-year-old children. In the first column is the numerical order of the Binet questions as arranged by Burt. Note that the list does not extend below question 10 nor above question 59. The reason for this is that beyond this range one of the age groups received either 0 or 100 per cent right answers, which renders scaling for those questions impossible for these two age groups. The questions so eliminated can, however, be scaled for higher or lower age groups. The second column gives a brief description or designation of the Binet questions to facilitate
( 441) identification. The next column shows the actual percentage of seven-year-old children who answered each question correctly. The next column after that gives the similar facts for the eight-year-old children. These data are all copied directly from the tables of Burt for London school children.
The next two columns show the relative difficulty of each question for each age group expressed in terms of the standard deviation. These figures a obtained directly from the two percentage columns. Thus, for example, question 40 was answered correctly by 39.1 per cent of the seven-year-old children. Since less than half of the children in this ago group answered this question correctly, that question belongs on the positive side of the difficulty scale. Its sigma standing is +.28σ which is read directly from a table of areas of the probability surface.[1] In other words, at point +.28σ there remains 39.1 per cent of the surface to the right of that point.
The same question, 40, was answered correctly by 68.2 per cent of the eight-year-old children. Since more than half of the children in this age group answered this question. correctly, the question belongs on the negative side of the mean for the eight-year-old children. Its exact location is �.47σ, since 68.2 per cent of the whole surface lies above that point. It should be noted that the majority of the seven-year-old children fail on this question and that the majority of the eight-year children succeed with it. That is the reason for the difference in sign.
In the last two columns are recorded the squares of the sigma values. These are used in calculating the standard deviations s7 and s8.
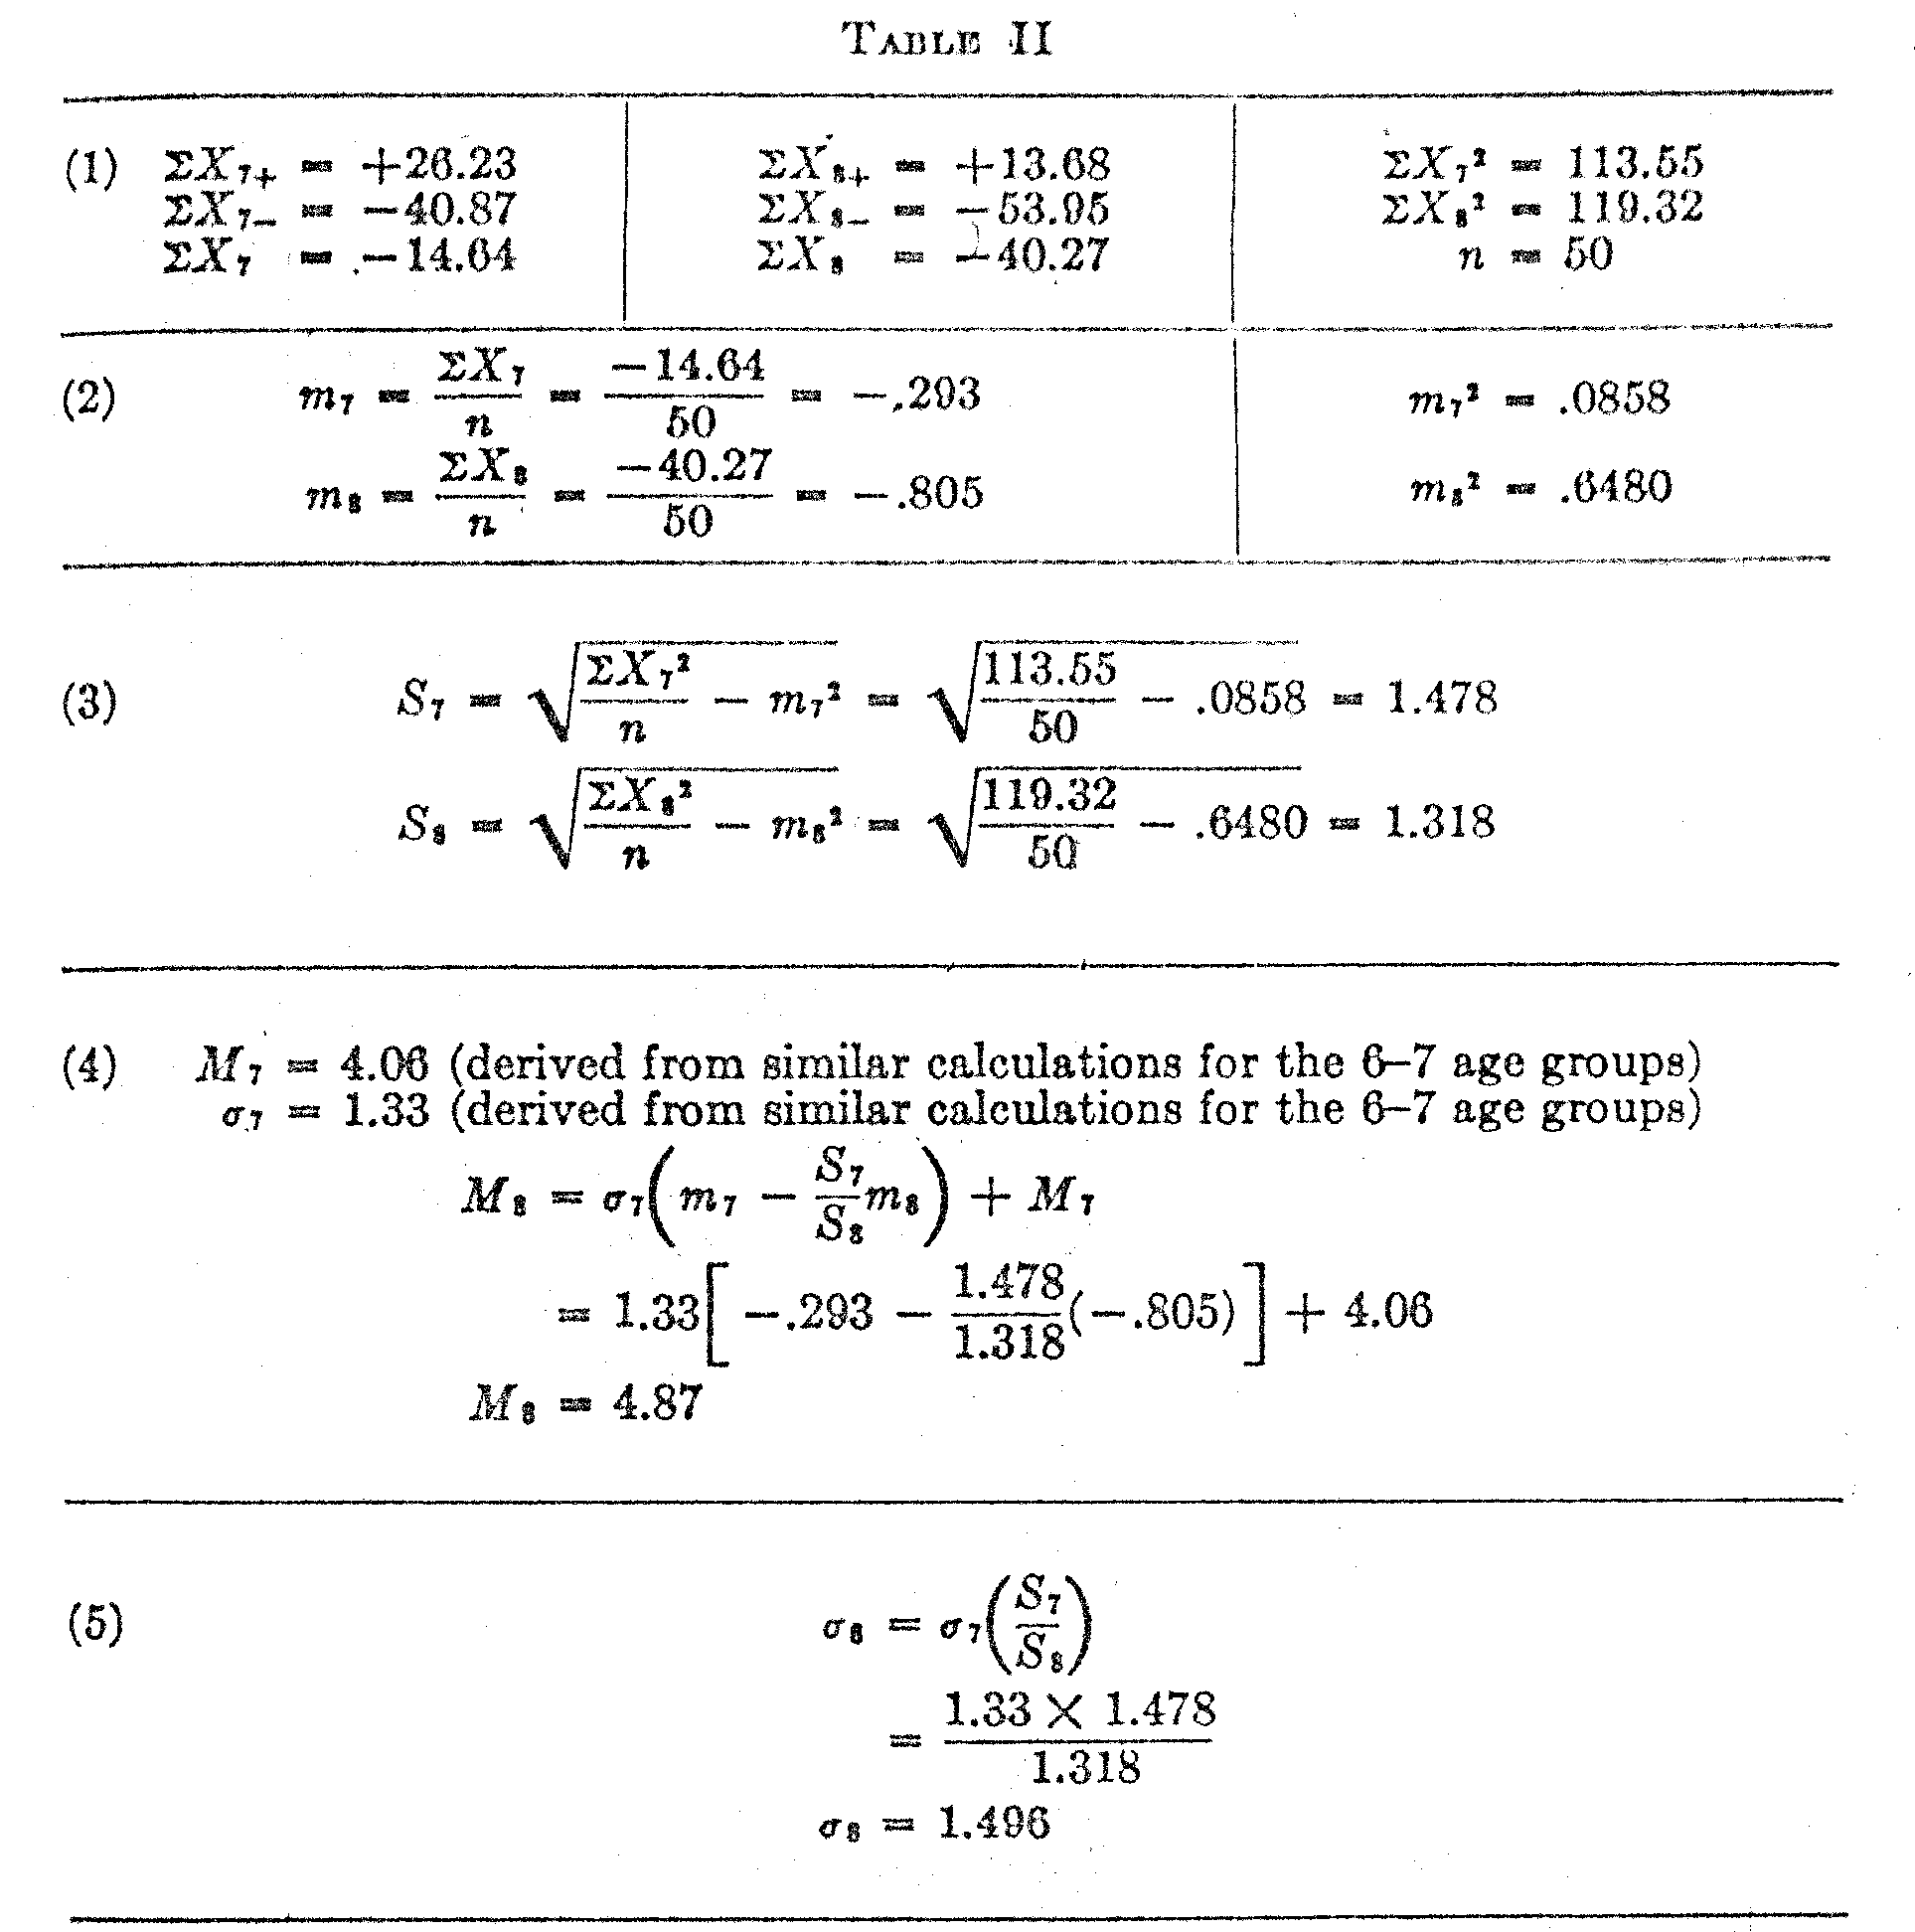
In Table II are shown the calculations corresponding to the data of Table I. Note that the scale values of M7 and of σ7 are here known because they have been derived from the similar calculations for the lower age groups.
Tables I and II show all the calculations for establishing the values of M8 and σ8 . Similar tables can readily be prepared for any two adjacent age groups in order to extend the determinations to any desired age range.
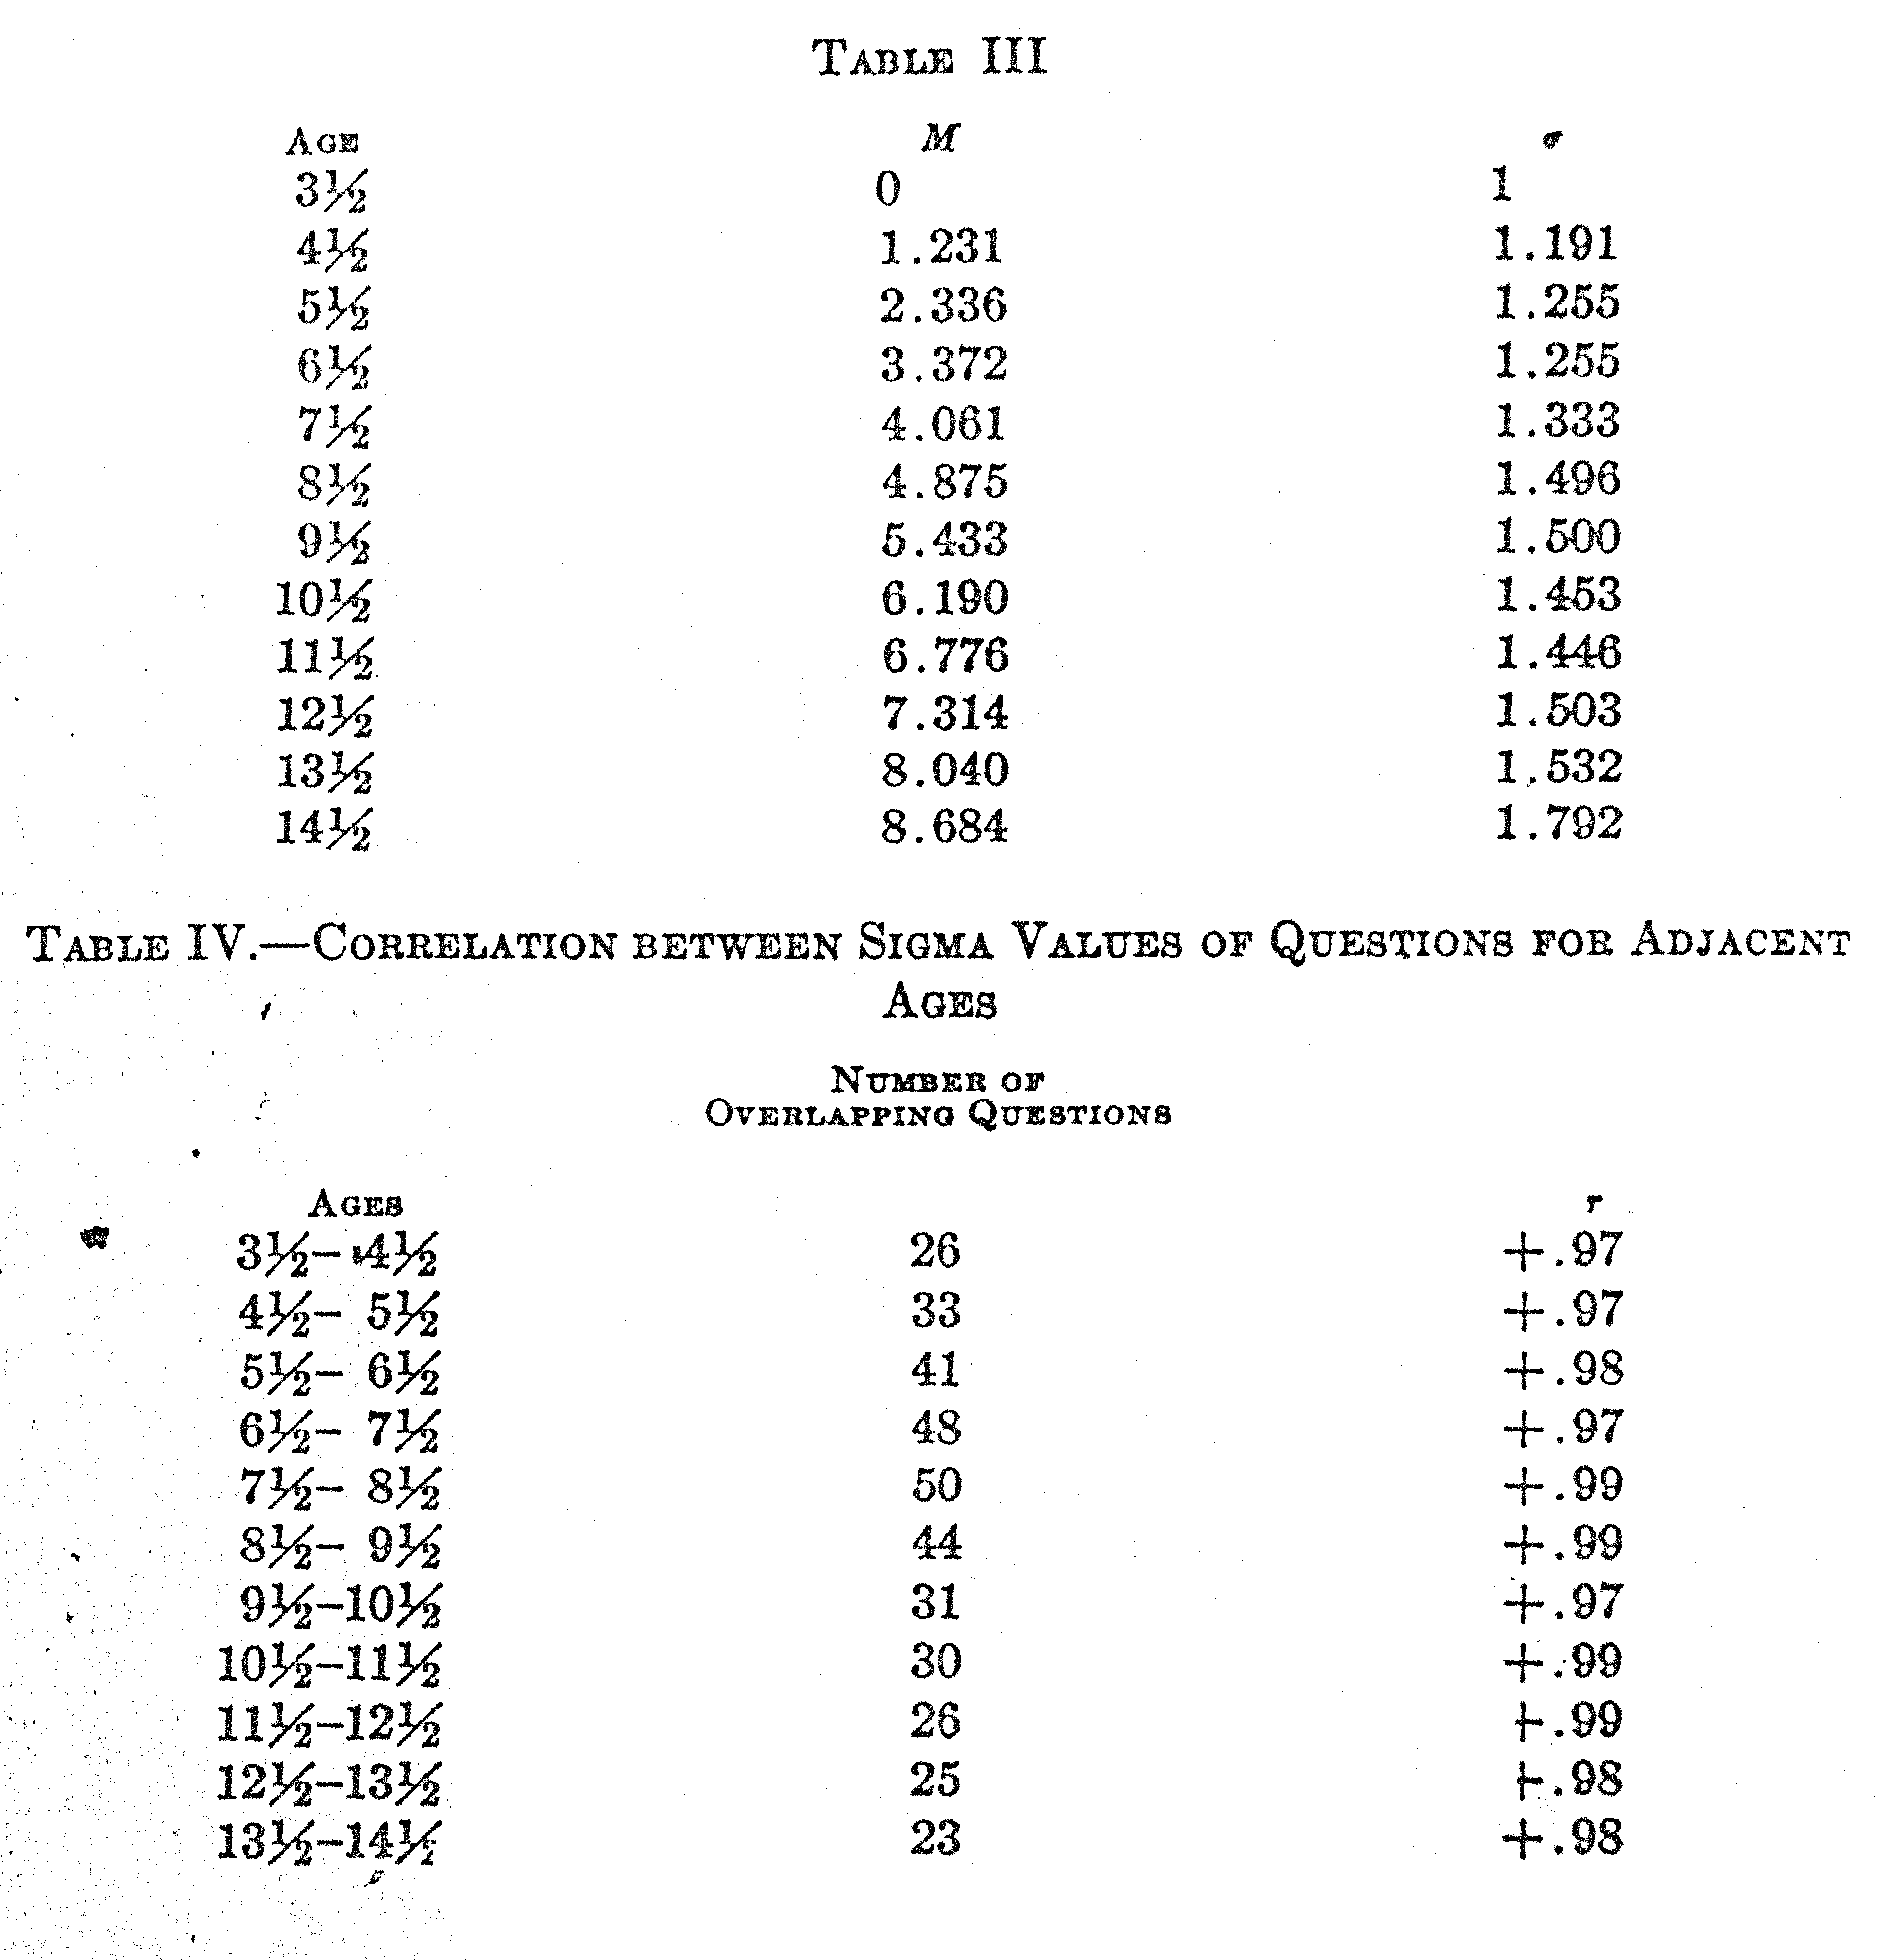
In. Table III we have the result of such calculations for the age range 3 to 14, inclusive, according to Burt's data. In the first column
( 442) is recorded the average age of each successive age group. The second column shows the scale value of the mean test-intelligence .of children of each age group, expressed in terms of the standard deviation of three and one-half-year-old children and with the mean of that age group as an origin. In the third column is shown the standard deviation of each age group with the same unit of measurement. The calculations for each ago were carried out shown in Tables I and II.
The first calculation is made for the lowest age groups, three and four, and the formulas are somewhat simplified for that determination in view of the fact that M3 is zero and σ3 is unity, these two values being assumed for the construction of an absolute scale.
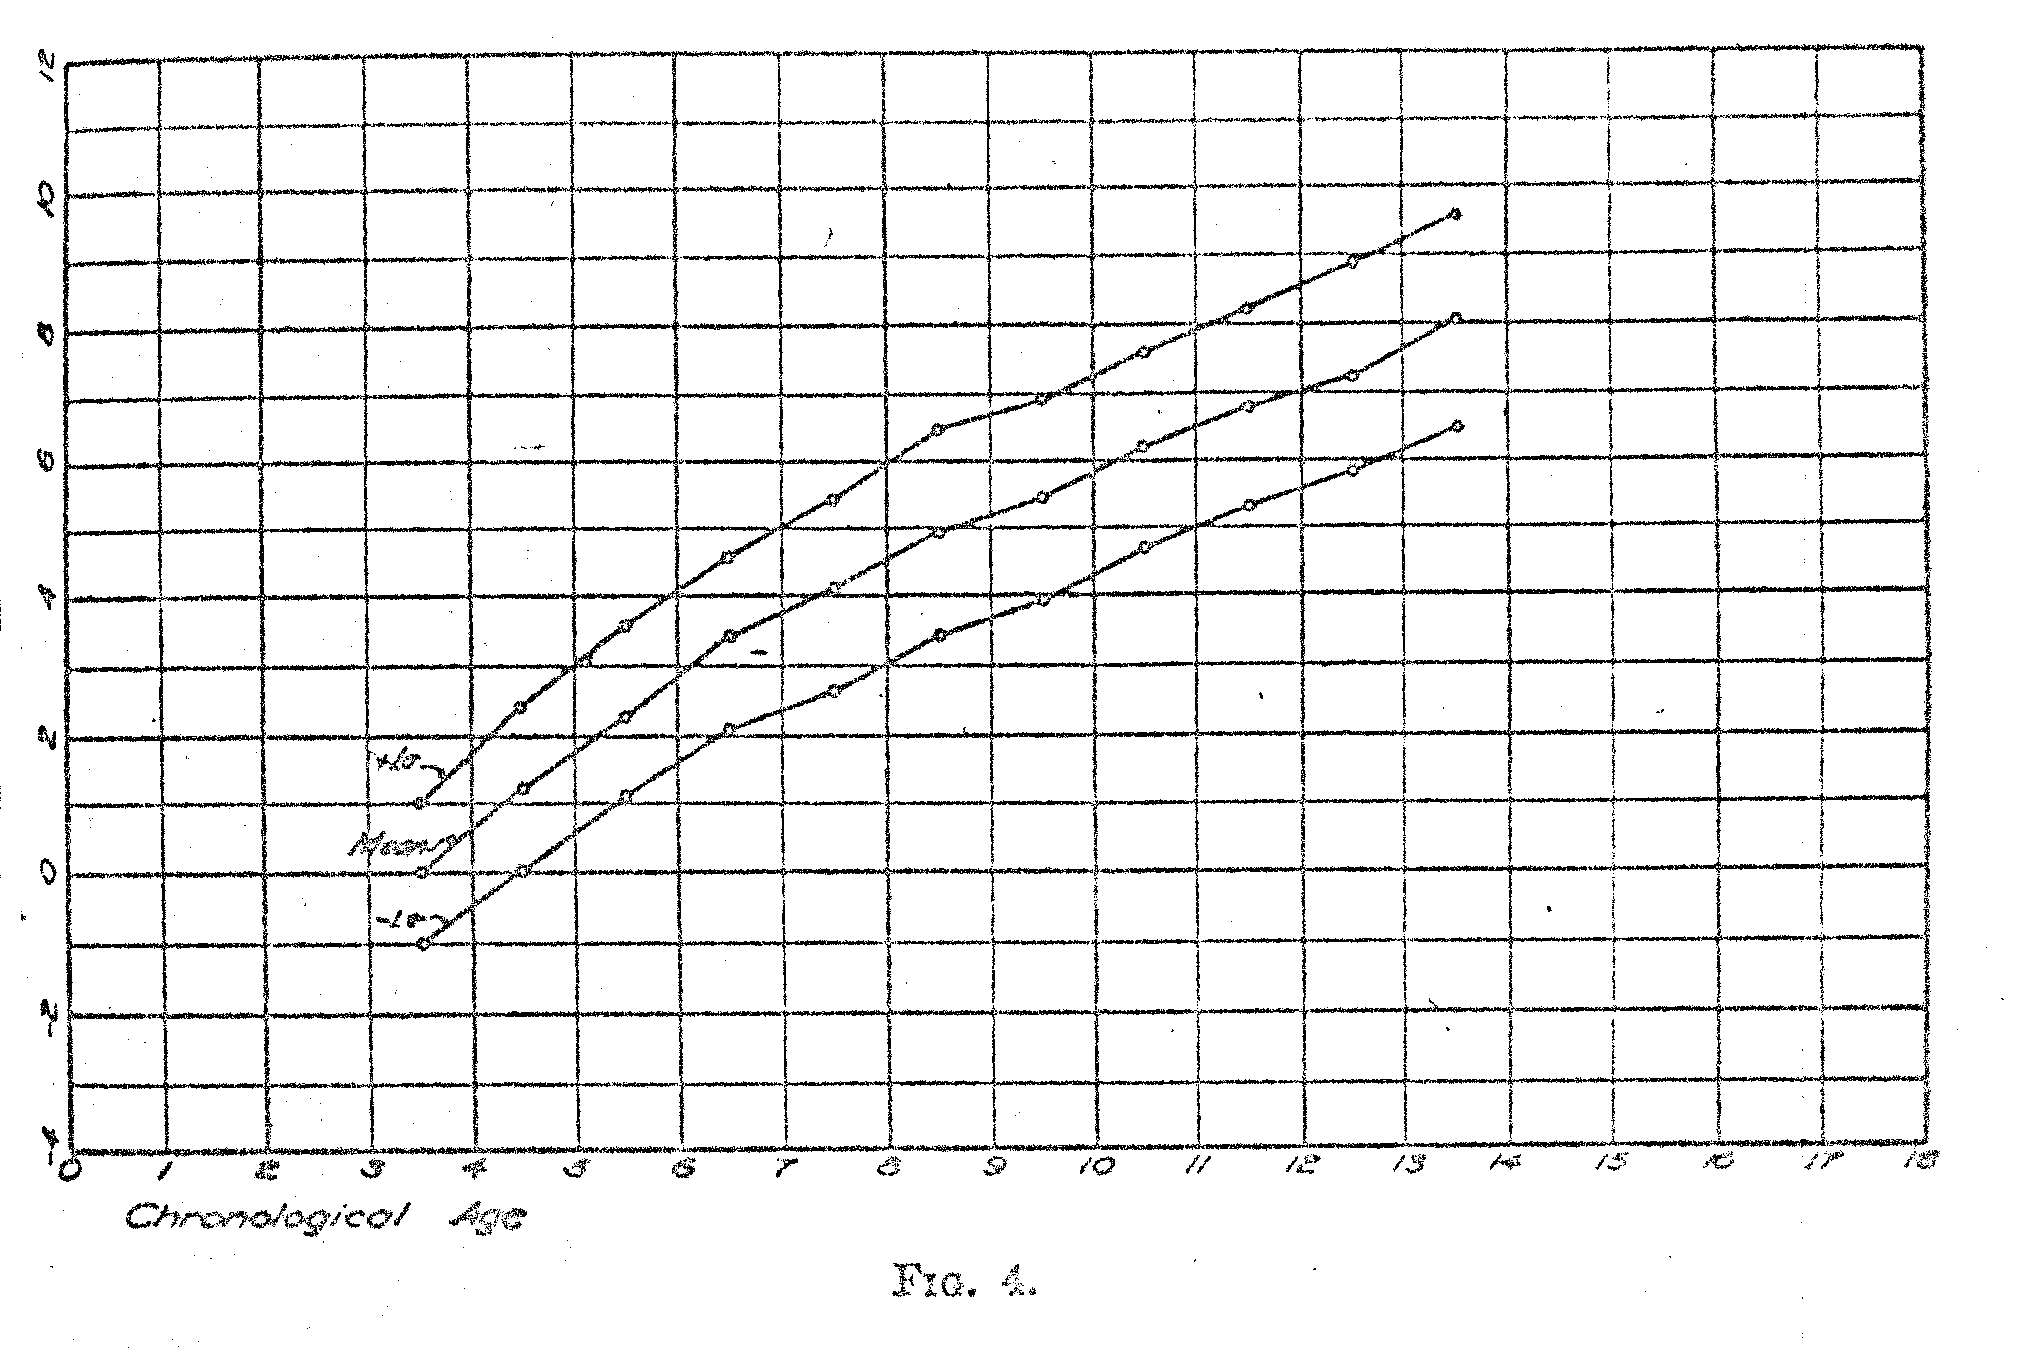
In Fig. 4 the data of Table III have been represented graphically. The base line represents chronological age and the ordinates represent the absolute scale of Binet test intelligence. The middle curve is taken directly from column 2 of Table III and it shows the mean intelligence of children of successive ages. Note that the points on the curves are plotted at the half-year ages to correspond with the classification of the children in the original data of Burt according to their last birthday. A striking feature of this curve is that it continues to rise even at the age of 14 with no indication of reaching a level. It certainly looks as though the kind of intelligence which is measured by the Binet tests and their variations continues to grow` as rapidly at the age of 14 as it does at the age of 9. This conclusion contradicts the statements frequently made to the effect that mental test intelligence approaches an adult and more or less stable level at 14 to 16 or 18 years. The appearance of these curves indicates that the growth of test intelligence continues beyond the age of 14. The continuity of the curves is such that one can hardly imagine that they will bump into an adult final level of some kind at 16 or 18 and then stay there. When we talk about adult intelligence as having been reached some-where in the middle of the 'teens, we are not sufficiently cautious in recognizing the mechanical limitations of the scale. If the scale stops at 16 so that no one can attain a rating higher than that, it is clear; that the average for the whole population will be a little lower than the maximum point on the scale. Those who are below the maximum get their true rating, but those who are above the maximum point on the scale get only the maximum possible rating. When these ratings are pooled into one average, it will, of course, be a little below the maximum point of the scale.
( 443)
The Binet scale is extended from one year to the next by inserting new tests on which the higher age groups do better than the lower age groups. It should be extended beyond the age of 14 or 16 by inserting tests on which older subjects succeed better than younger ones. It is difficult to find test questions of the ordinary type in which such differentiation is possible, but our inability to find them does not prove that the development of intelligence stops somewhere in the 'teens. Common sense judgment certainly favors the assumption that the average man of 40 is more intelligent than the average boy of 20, but so far we have not been able to measure that difference.
Instead of acknowledging this limitation in our measurement methods, we have not infrequently attempted to juggle with the definition of intelligence to make it fit the measuring devices that are accessible.
The validity of the method here described depends largely on the linearity of the plot of the X-values for any two adjacent age groups. In order to test the consistency of the method throughout the age range here considered, correlation tables were plotted for all the adjacent age groups with results as shown in Table IV. It will be readily seen that all the co relations are above +.97. If the distributions of test-
( 444) intelligence for any of the age groups should not be normal, these plots would not be linear, and the correlations would be correspondingly reduced. The linearity of all the graphs is very conspicuous and similar to that of Fig. 3.
The upper curve in Fig. 4 shows the growth in Binet test intelligence of those children who rank +10- with reference to children of their own age. The lower curve shows similarly the growth curve for those children who rank --10 with reference ,to children of their own chronological age. It is interesting to note that these curves tend to separate with advance in age. The interpretation of this fact is that the absolute variability of intelligence increases with age.
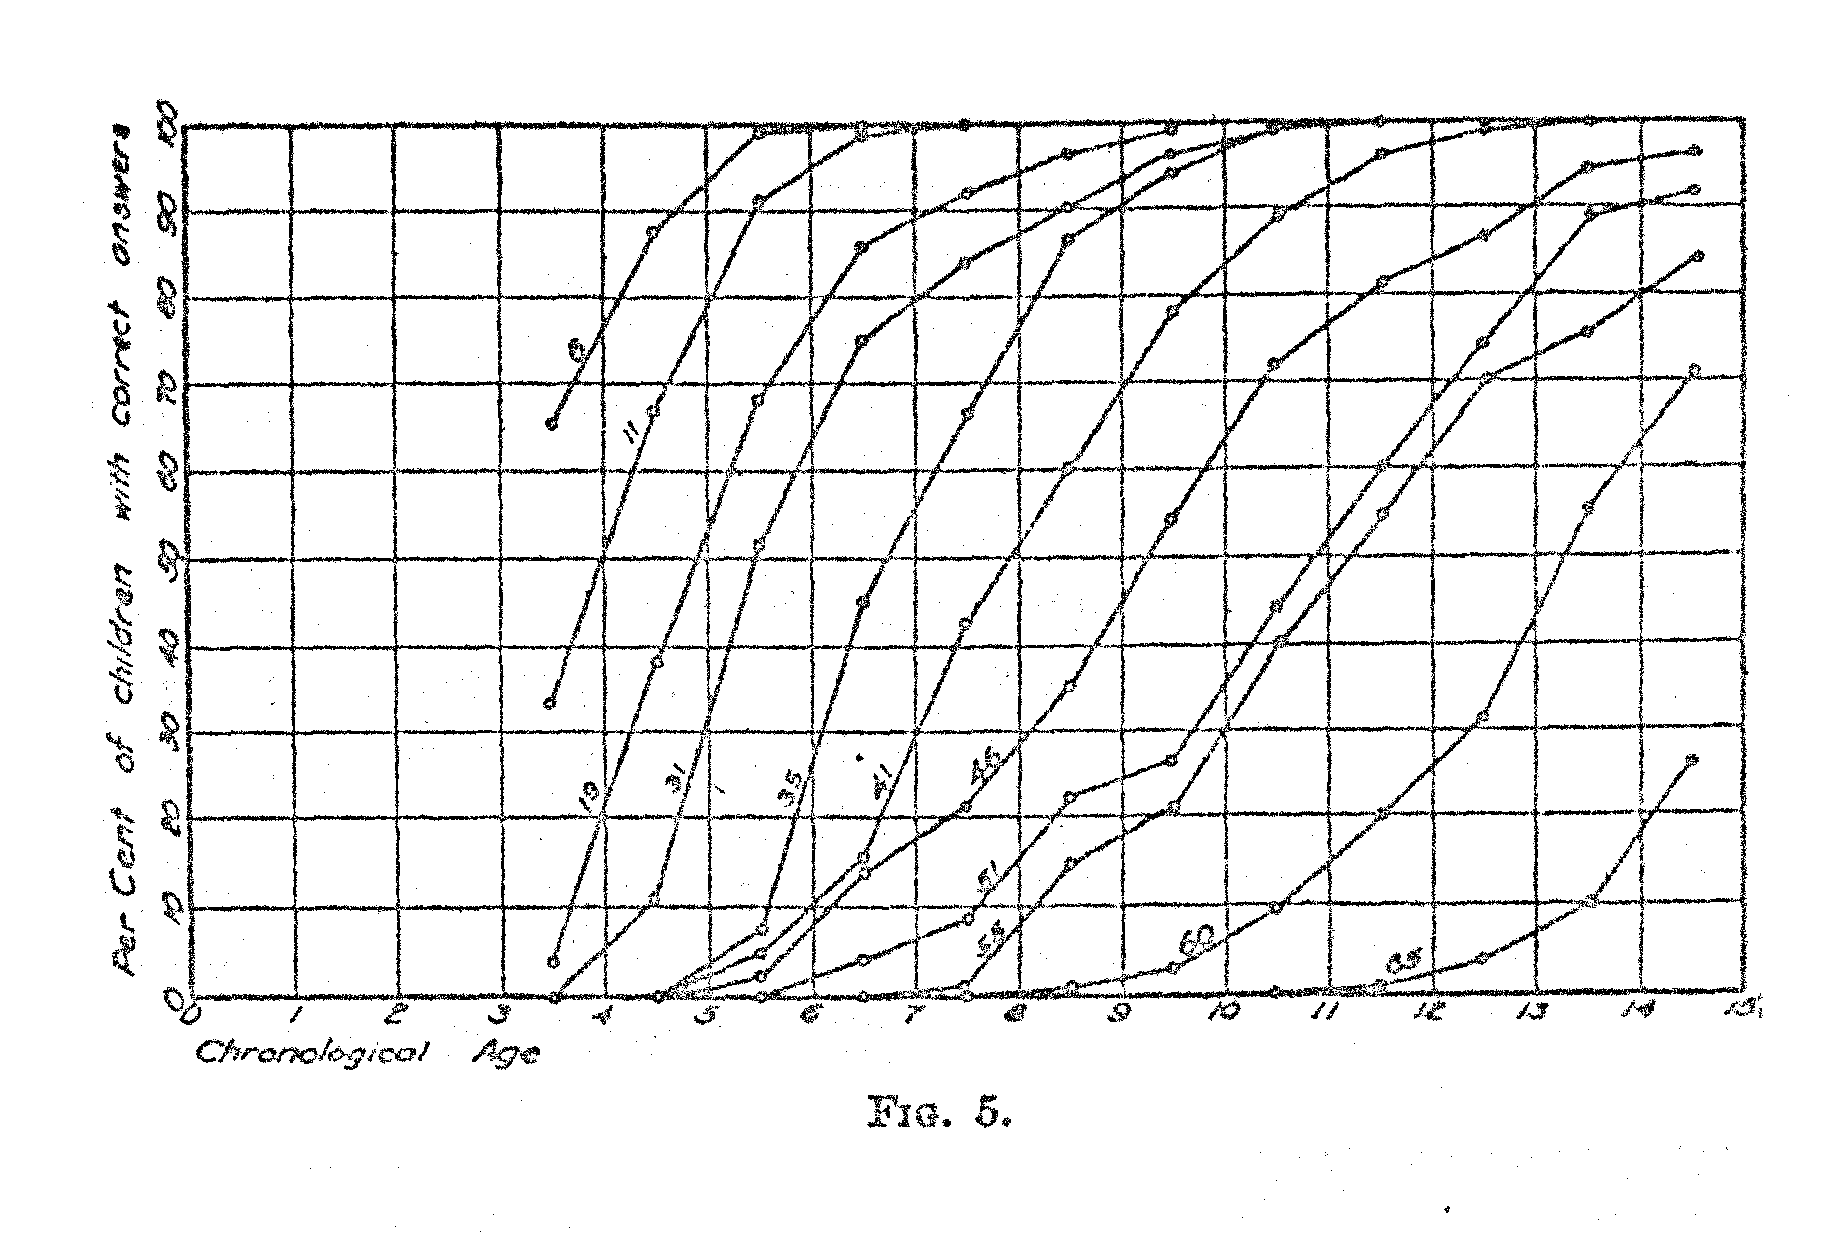
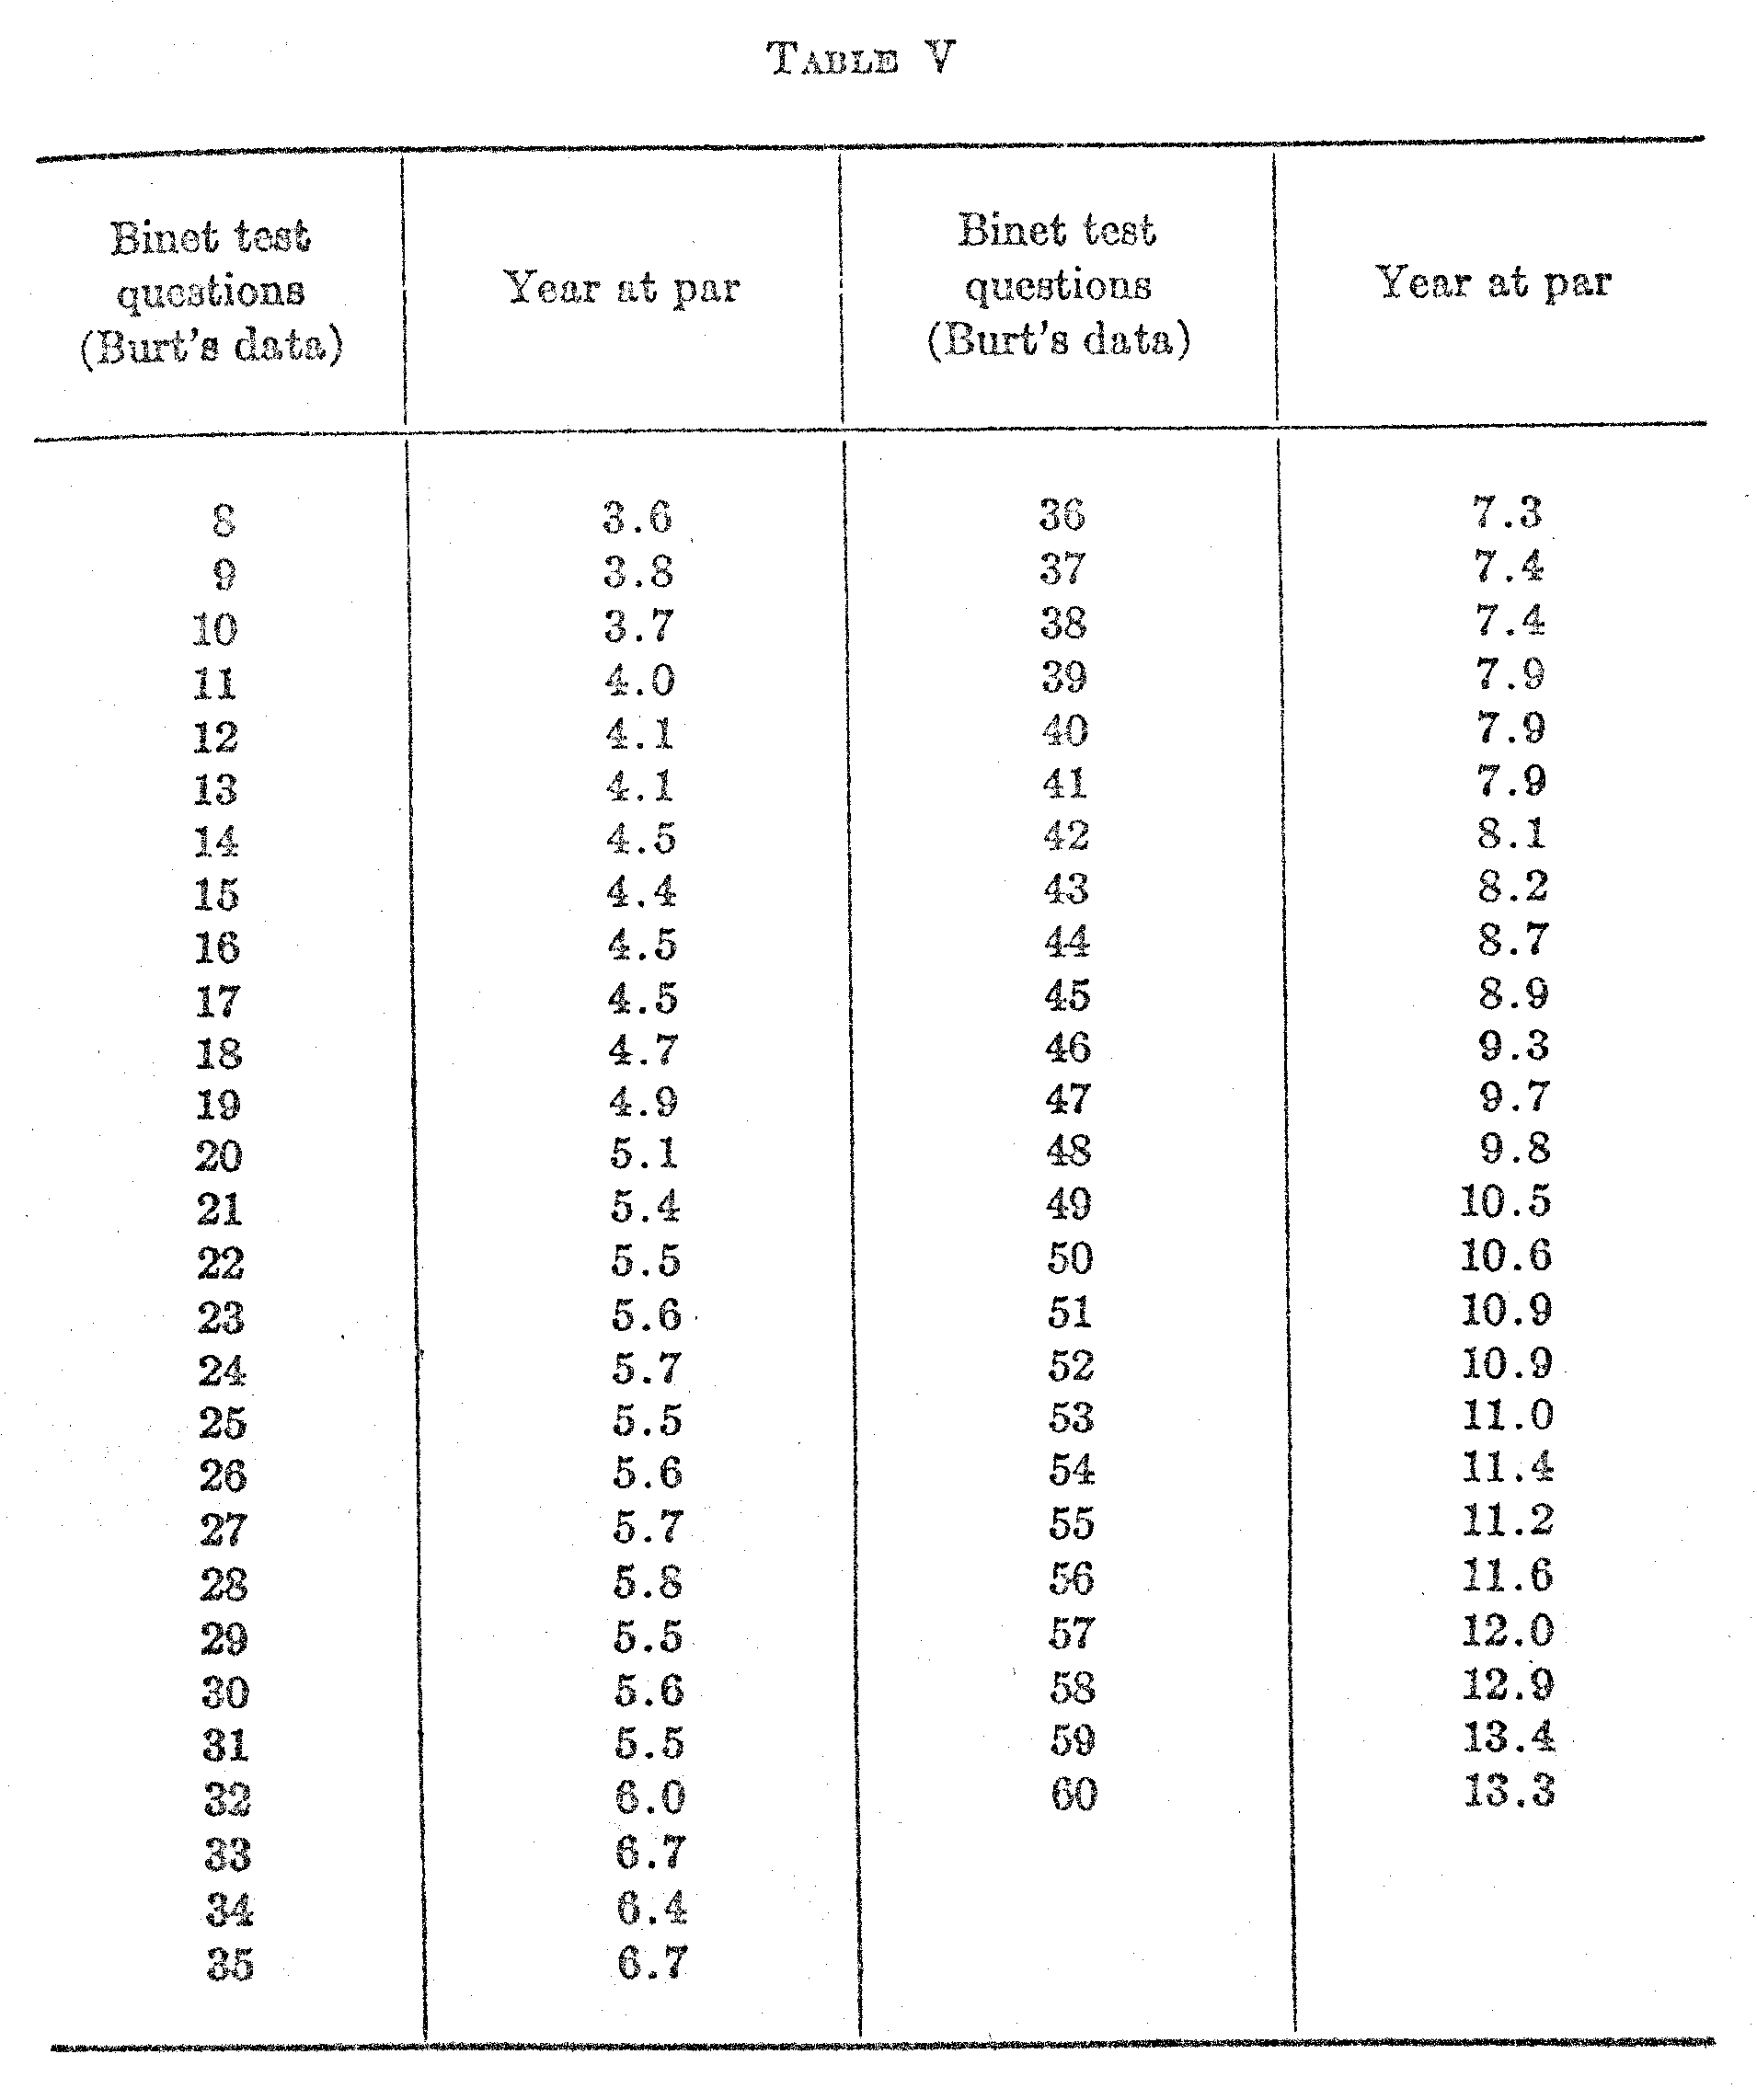
The next step in our analysis is to ascertain the chronological age at which each test question is at par. In other words, what is the average age of the children, 50 per cent; of whom pass a certain test question? In Fig. 5 we have represented the per cent of children of successive ages who pass a given test question. Curves are shown for a random sample of questions. It was not possible to include curves for all the, 05 test questions on one chart, because of the lack of space. But the curves shown indicate the nature of the function. The numbers on the lines indicate the numbers of the Binet test questions. Inspection of Fig. 5,. shows that the functions are similar for practically all test question with some noticeable variation in the slope of the curve.
( 445)
A refined statistical method for ascertaining the age at par for each test question would be to fit an equation to the curve for each test question and then to ascertain the point at which the curve intersects the 50 per cent level. This would be rather laborious and it would not appreciably increase the accuracy of the short-cut that is here adopted because there is some error in the original percentages themselves.
In order to ascertain the age at which a particular test question is at par we draw a curve for that question similar to the curves in. Fig. 5: We note the percentages immediately below and above 50. Call these percentages p1 and p2 respectively. Then the interpolation is represented by the following formula:
Age at par = Y + ((.50 � p1) / (p2 � p1)
in which Y = age which has P1 correct answers.
p1 and p2 are the two percentages immediately below and
above 50.
Applying this method to Question 8 in Burt's tables as an example, we have
Age at par = 3.5 + ((.50 � .45) / (.83 � .45) = 3.6
In Table V we have the test question as listed by Burt together with the age allocation of each question by the method here described. The age allocation is so determined that a large random sample of children of the specified age at par would give approximately 50 per cent right answers to the particular question. Older children would give correct answers more often, and younger children would give correct answers less often. It was not possible to give a definite age allocation to some of the questions in the Binet tests at the lower end and at the upper end.. The first few questions were so easy that the lowest age group in Burt's study, the three-year-old children, gave more than. 50 per cent right answers and the last few questions were so difficult that less than 50 per cent of the 14-year-old children gave right answers. Of course one could resort to make-shift in scaling these test questions but it must be recalled that the functions shown in Fig. 5 are not all parallel. Hence the advisability of finding experimentally those age groups which get close to 50 per cent of the questions right.
( 446)
( 447)
It will be seen from Table V that the test questions are more numerous at certain ages than at others. For example, there are 12 questions that scale at par between the ages five and six, whereas there are only four questions that scale at par between six and seven.
If we desire to ascertain the scale value of each test question it can be done best by noting the two percentages just above and just below 50 in curves like those of Fig. 5. Let these two percentages be p1 and p2 as before, and let X1 and X2 be the corresponding sigma values. Then we have for the scale value the following determination.
Scale value of test question = 1/2 [(M1 + X1σ1) +(M2 + X2σ2)]
( 448)
Applying this procedure to Question 40 as an example, we have the following numerical values
p7 = .391
p8 = + . 682
X7
= +.277 X8
= � .473
M7
= 4.061
M8
= 4.875
σ7 = 1.333
σ8 = 1.496
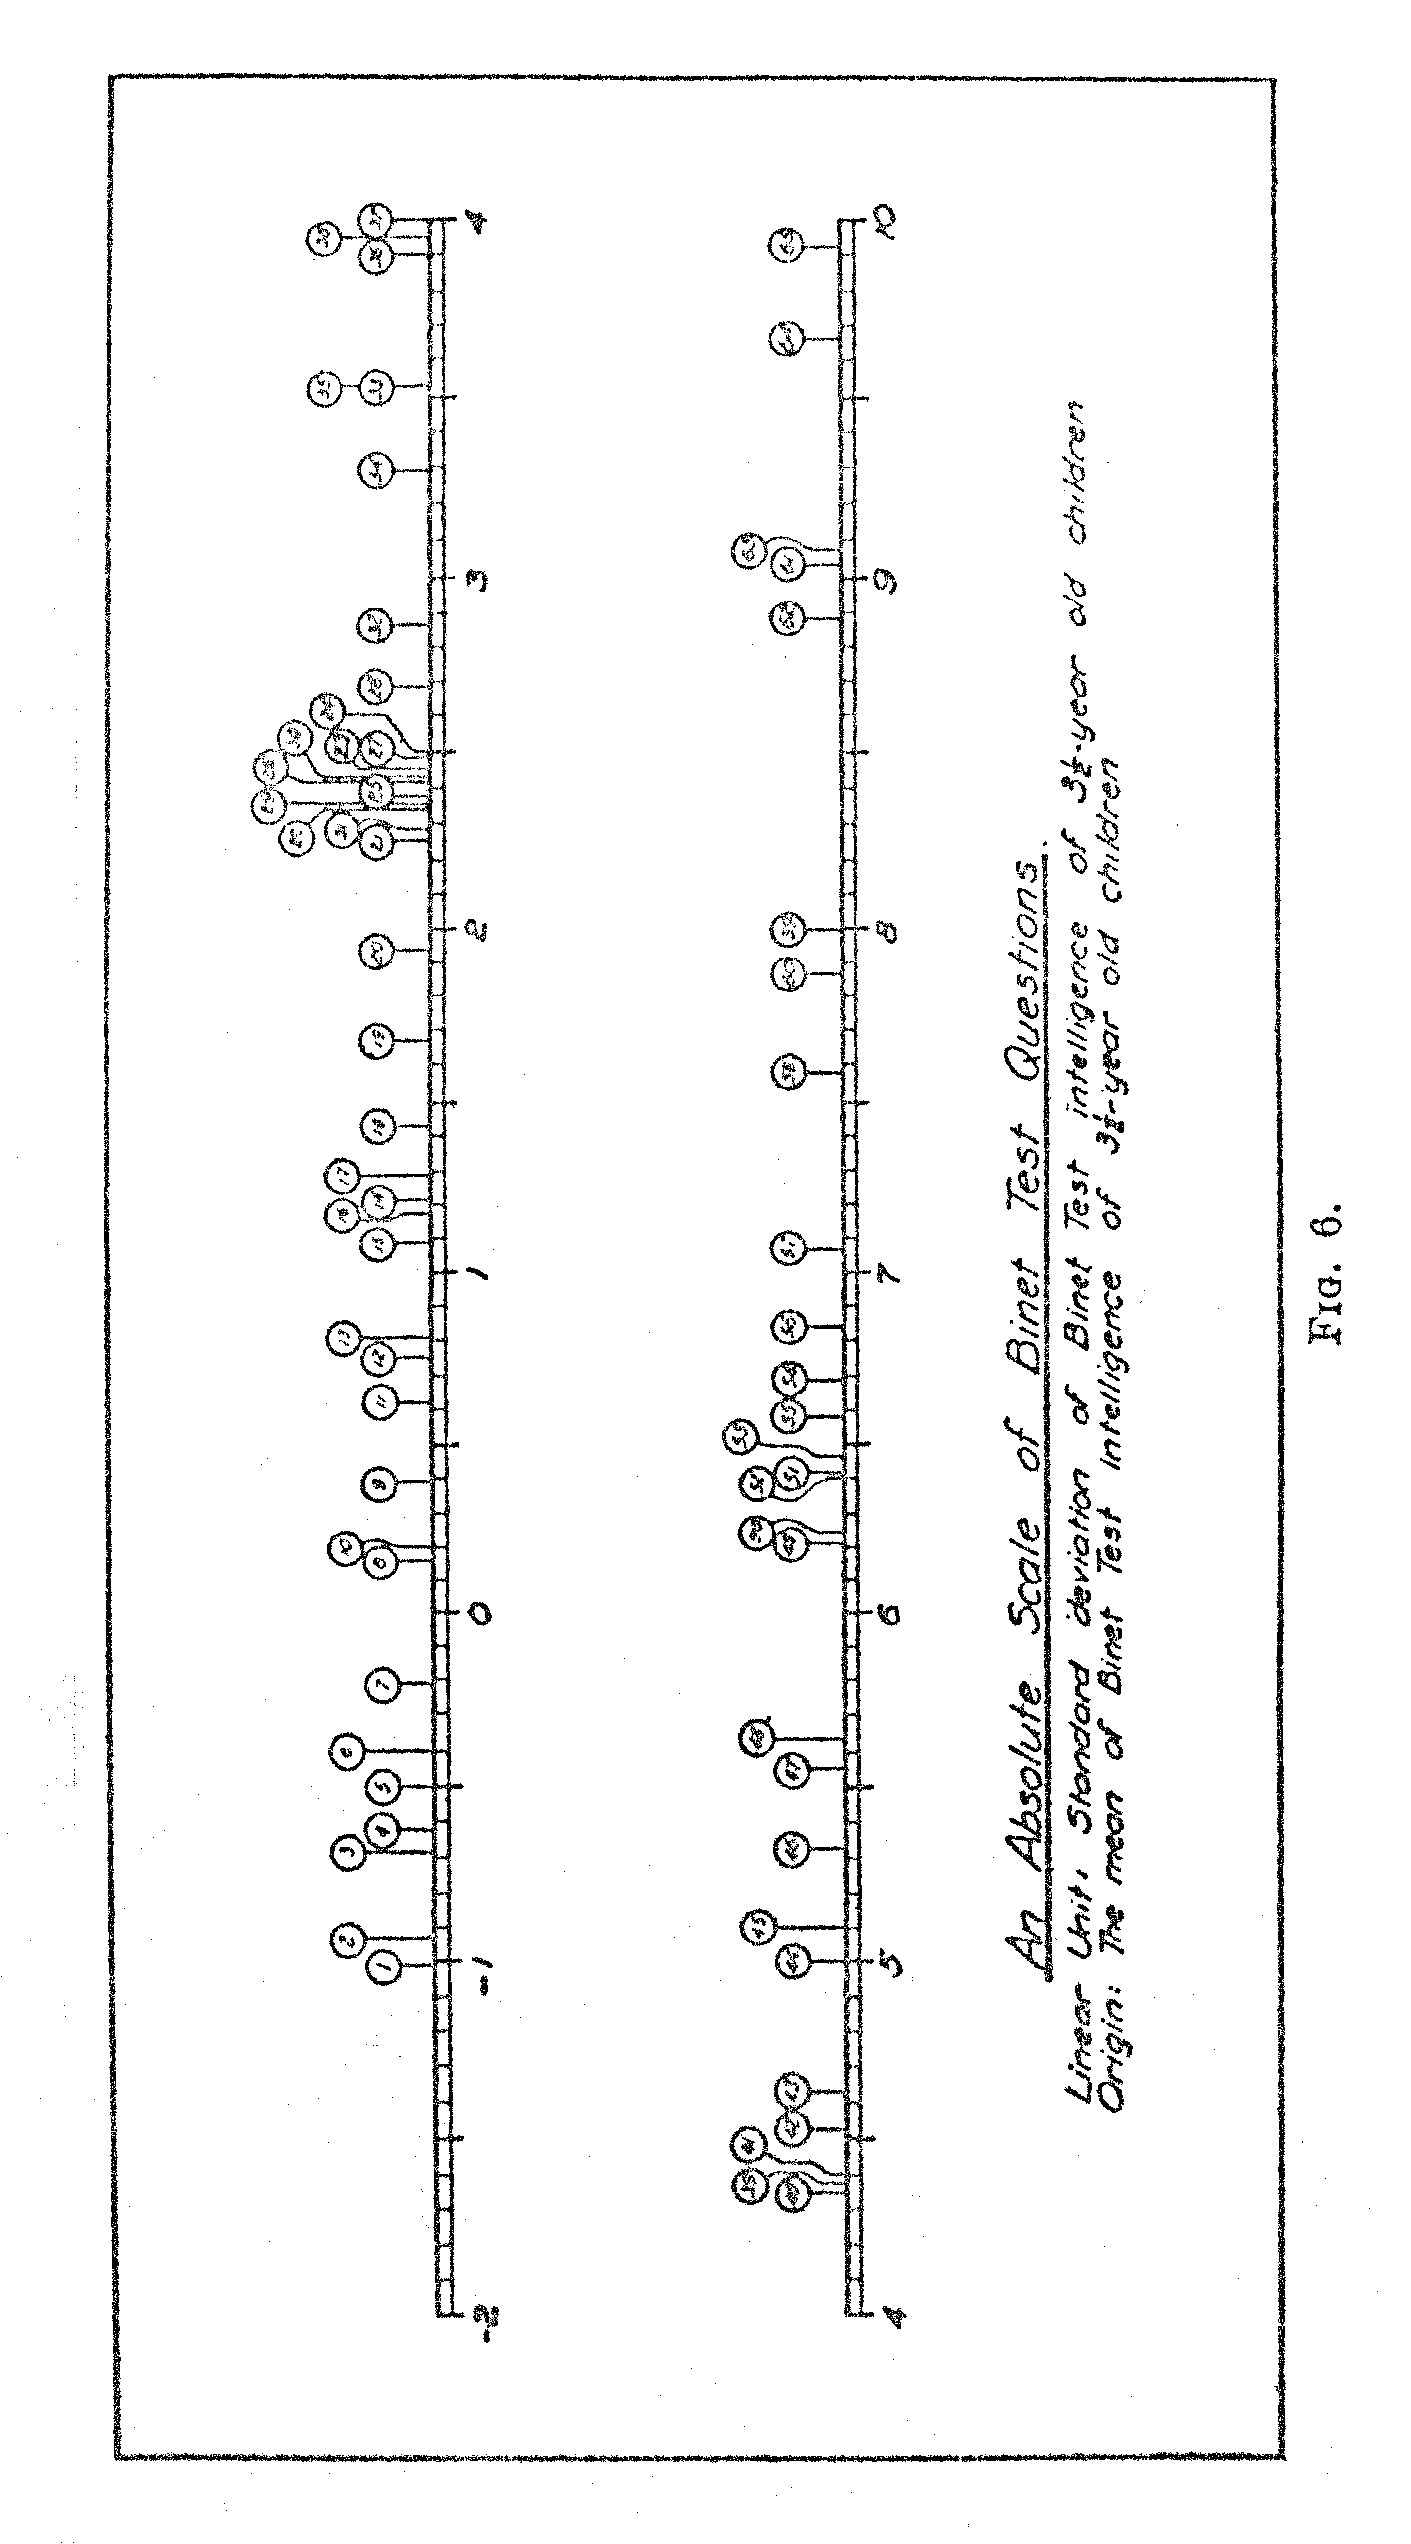
These values give a scale value of 4.3 for Question 40. The scale value of particular test questions may also be determined by interpolation between the scale values of the ages corresponding to p1 and p2. These two methods give practically the same numerical results. This latter method was used for the determination of the scale value of each test question. The result is shown in Fig. 6 which also brings out rather strikingly the fact that the questions are unduly bunched at certain ranges and rather scarce at other ranges.
SUMMARY
An absolute method of scaling tests is here proposed which assumes that the distributions of ability in the several age or grade groups are normal but which allows freedom of variation for the means and for the standard deviations of the several age groups. The method is illustrated chiefly by Figs. 2 and 3 and Tables I and II, The type of result that obtained by the method is illustrated by Fig. 4 and Table III.
The particular results of the method as applied to Burt's data for the Binet tests are of secondary value in this article but of some interest. Figure 4 shows that test-intelligence grows nearly as rapidly at the age of 14 as it does at the age of 9. This finding is not consistent with some current notions about so called "adult" intelligence at the age of 14. It may be that this curve, if continued; would drop its acceleration to reach a limit in the early 20s or perhaps even at the age of 20 but it can hardly be extended to reach a limit much sooner than that.
It is also found that the absolute variability of test-intelligence increases noticeably with age. For example, the variability of test-intelligence for children at 14 is nearly twice that of children at three.
The application of the present method of scaling to Binet test data shows that the distributions intelligence for children can be assumed to be normal at least as far as the age of 14.
( 449)
(450)
(451)