The Relative Merit of Advertisements:
Chapter 7:
Section 2: The Relative Merit of Fifty Advertisements
Edward K. Strong
After obtaining the above results regarding the effect of repetition on the value of advertisements, it was deemed worth while to study the relative merits of these advertisements as to "pulling-power." In all the previous experiments, as has been shown, the great defect in the value of the results has been the inability to ascertain the actual merit of any advertisement. The results in every case were relative. We could determine which advertisement in the set was the most effective, we could even state how many chances there were in a thousand that the first advertisement was superior to the second. But in no case could we judge the actual superiority of the first advertisement over the second; in other words, how much more business the first would bring than the second. The following experiment is an attempt to solve this question.
The ten subjects used in the repetition-experiment were retained and fifteen others, ten men and five women, were employed. Of the fifteen men five were married and had children. All of the twenty-five had had some experience in experimental psychology—such were selected in the hope that valuable aid might be obtained through introspections. The subjects represent fairly well the class of people who are appealed to by the advertisements, except that they lack a group of married women.
The following typewritten directions were given to the subject together with the fifty advertisements.
DIRECTIONS
Sort these 50 advertisements according to the order in which you would buy the snap.
Take for granted that each advertisement represents a different make of soap.
Arrange them into as many piles as you desire; but so arrange them that the difference in superiority of one pile over the next is " just noticeable."
If the superiority of one advertisement over the next is more than "just noticeable," leave as many gaps (empty piles) as you feel are needed to indicate this superiority.
After the sorting was completed a second set of directions was given them, as follows:
(67)
DIRECTIONS No, 2
Designate the pile, if there is such, which bas no appeal to you at all. The piles above it should then all have an increasing appeal for you to buy their soap and the piles below it should have an increasing negative effect upon you (i.. e., prejudice, distaste, or disgust with the soap).
Note down, as best you can, the reasons why you have thus arranged the advertisements. That is to say, what were the guiding principles in the sorting of the advertisements.
The subjects sorted the advertisements into piles ranging in number from six to thirty-seven. The highest pile was arbitrarily assigned the value of 100 and the pile, which the subject designated as having no appeal, was assigned the value of zero. The piles between these two were assigned values proportionately. The piles below the "no-appeal" pile were assigned correspondingly negative values. The values assigned to the advertisements in the following tables are thus figured from (1) the advertisements which the subject considered the best in the set and (2) from the advertisements which the subject considered of no appeal. Considerable care was taken in every ease that each subject understood the meaning of "no-appeal,"so that as far as possible it had the same content for all twenty-five subjects. It is believed that this zero point does actually approximate the zero point of appeal in advertisements. The 100 mark, of course, simply marks the best advertisement in the fifty. Whether that point is below perfection and, if so, how far must remain unanswered in this report. But from a business point of view the difference between the ideal advertisement and the best advertisement is of far less moment than the questions—"which is the best advertisement"; "how much better is it than the others in use";and "why is it better."
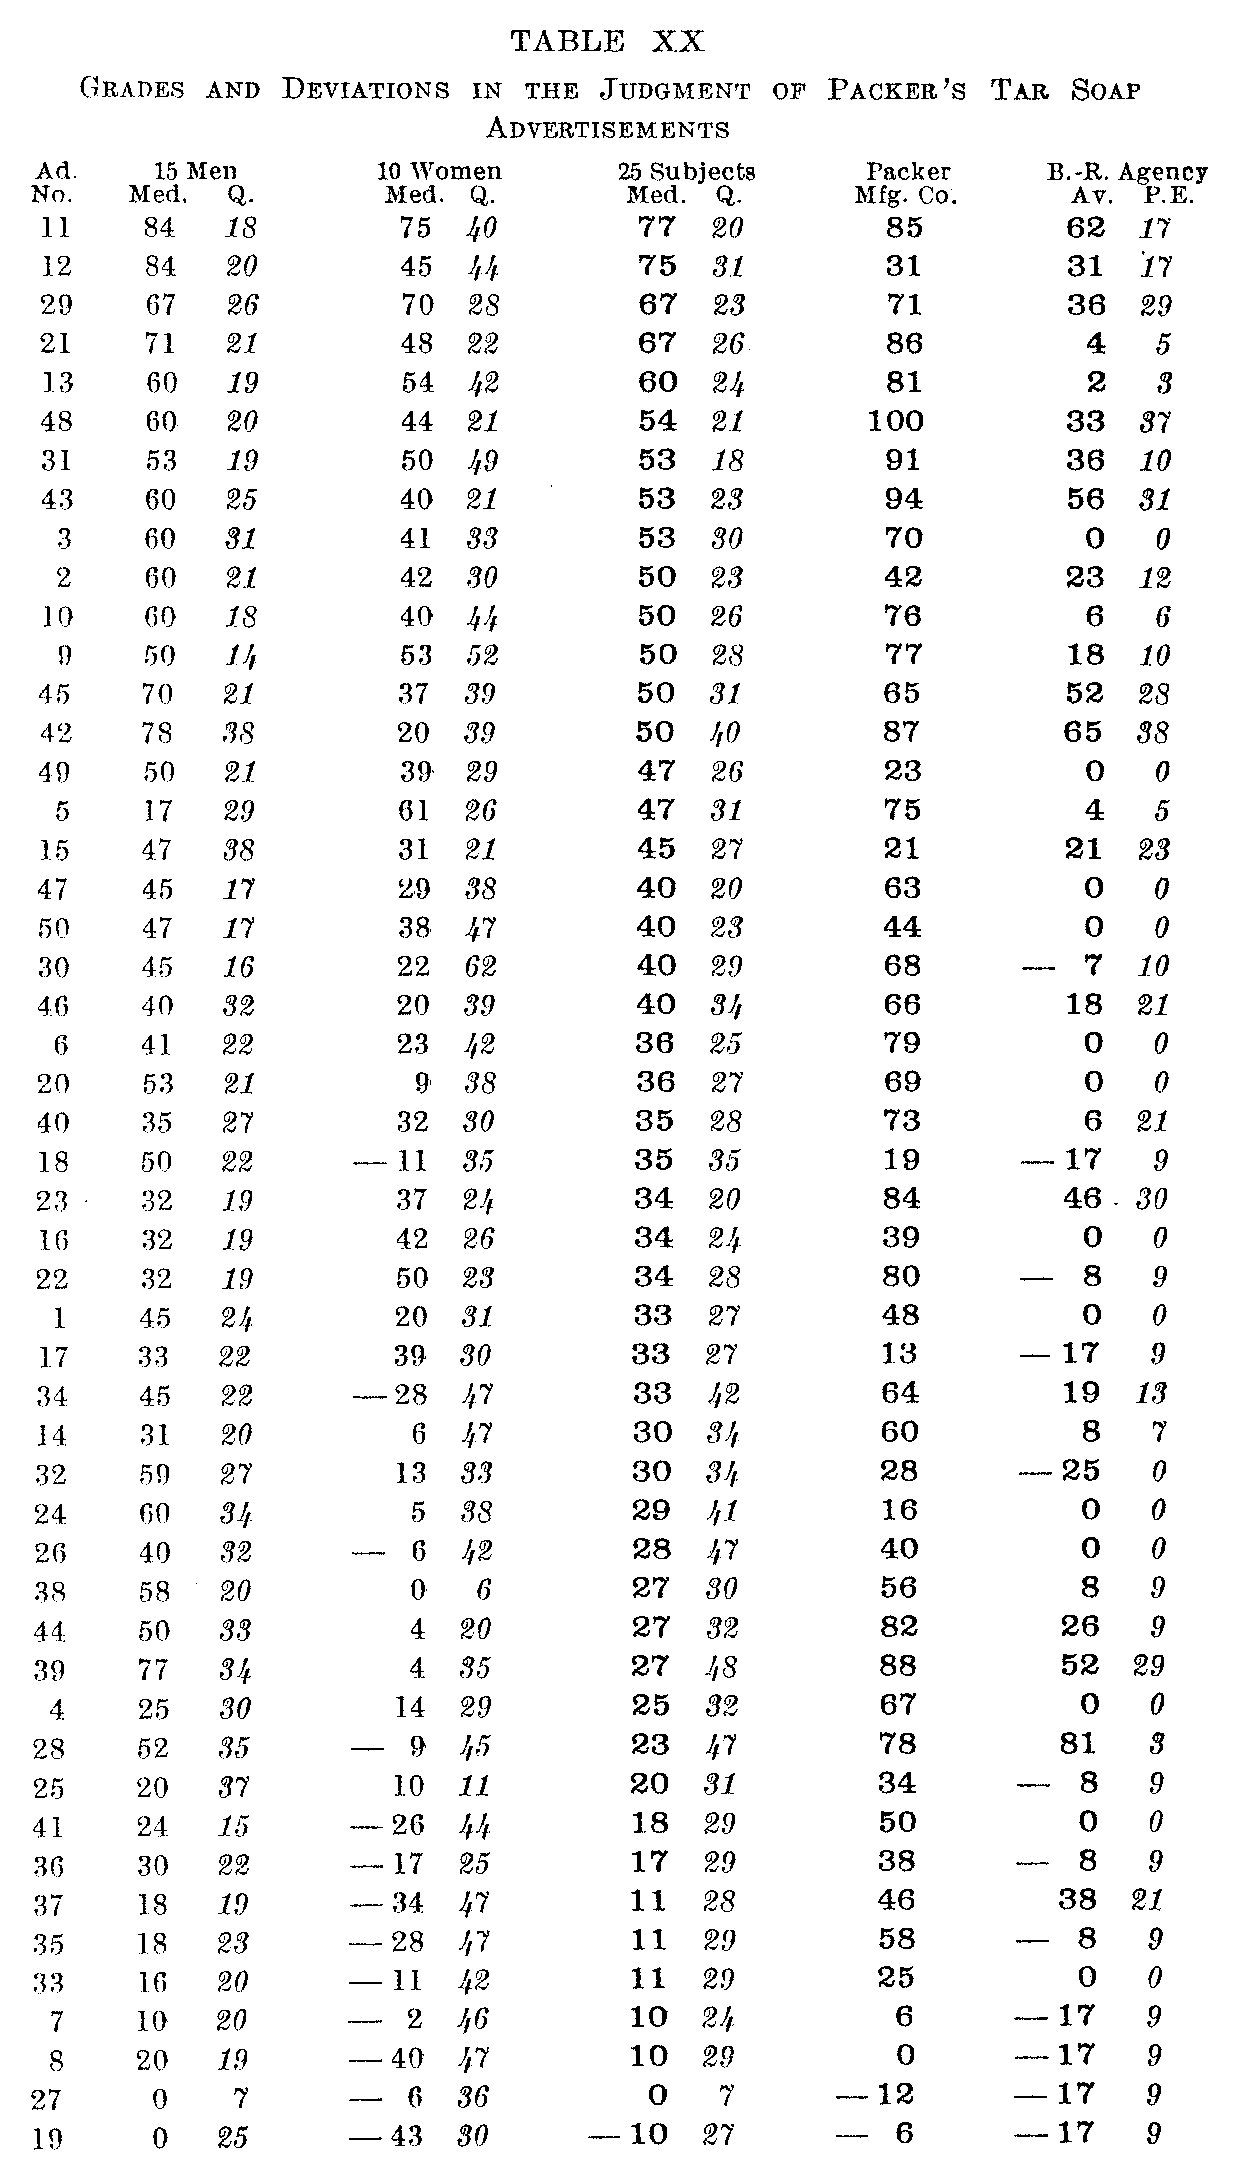
The results from the twenty-five subjects are set forth in Table XX. The median judgment with its quartile [1] is given. The first column lists the advertisements by number in the order of the medians of the twenty-five subjects. Then follow the results from the fifteen men, the ten women, and finally the combined results of the two groups. The fifth section gives the position of each advertisement as determined by Mr. Edward A. Olds, Jr., of the Packer Manufacturing Co., as based on the firm's experience. Here, as above, the best advertisement is graded 100, the advertisement of
(68)

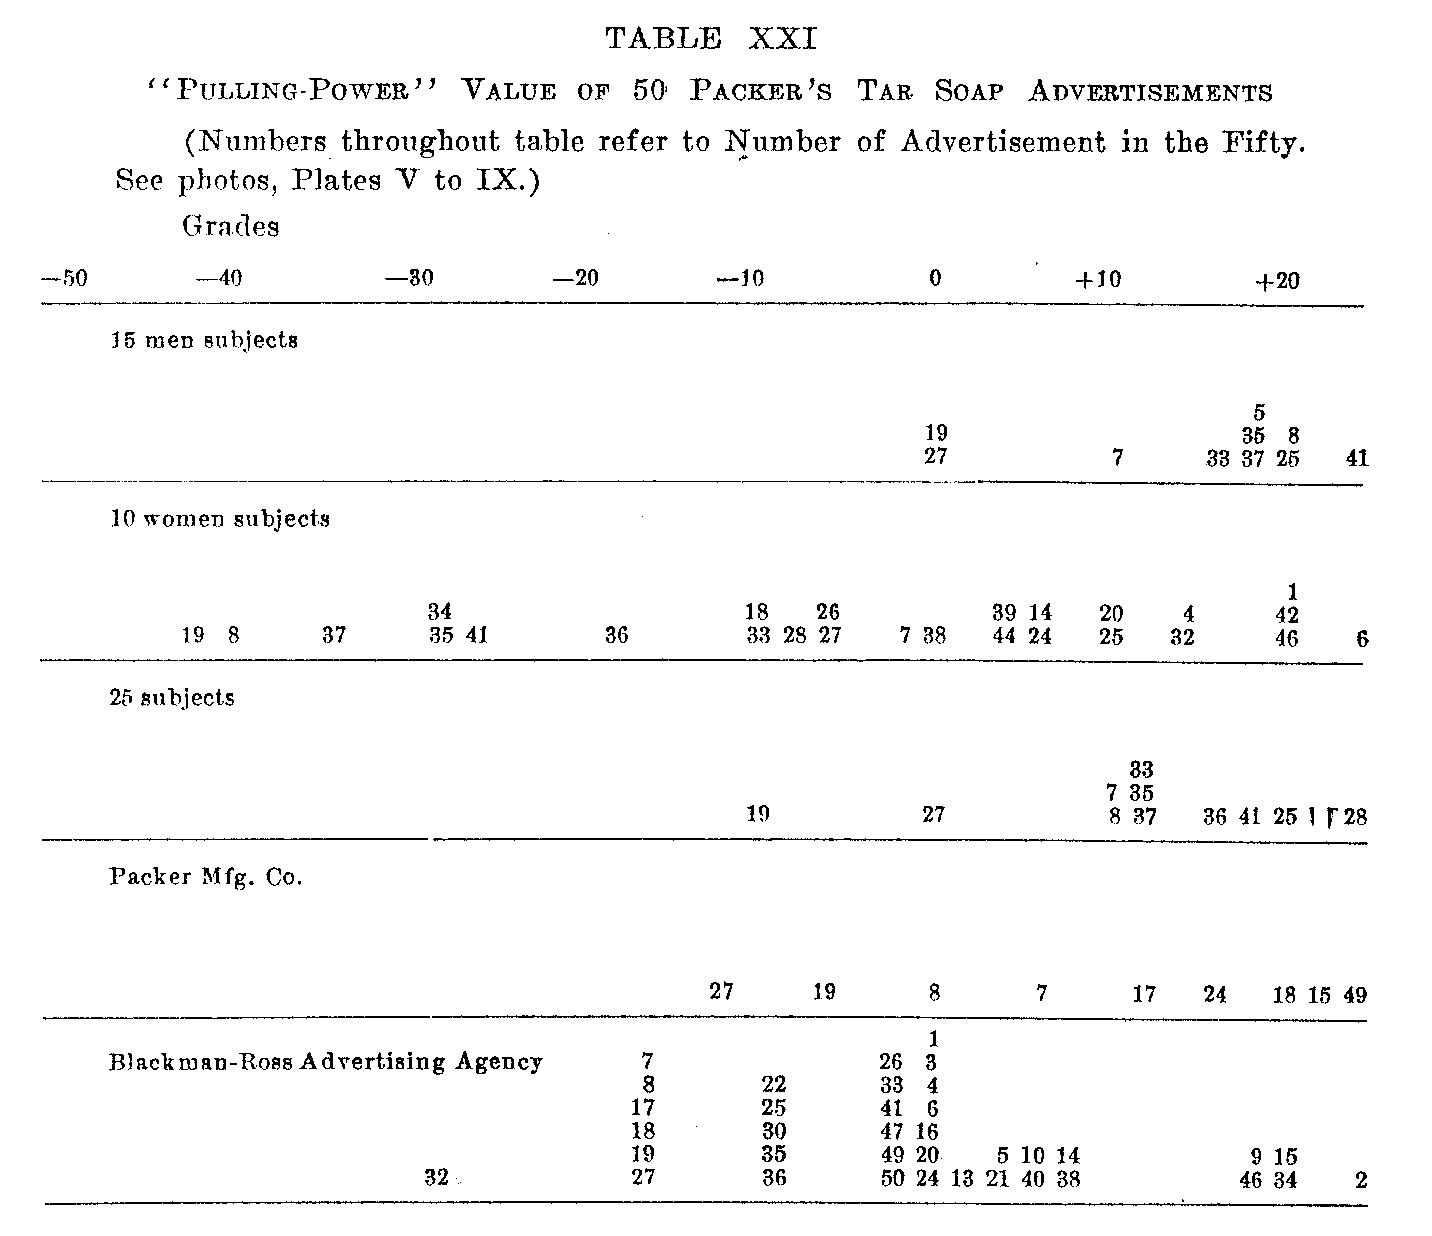
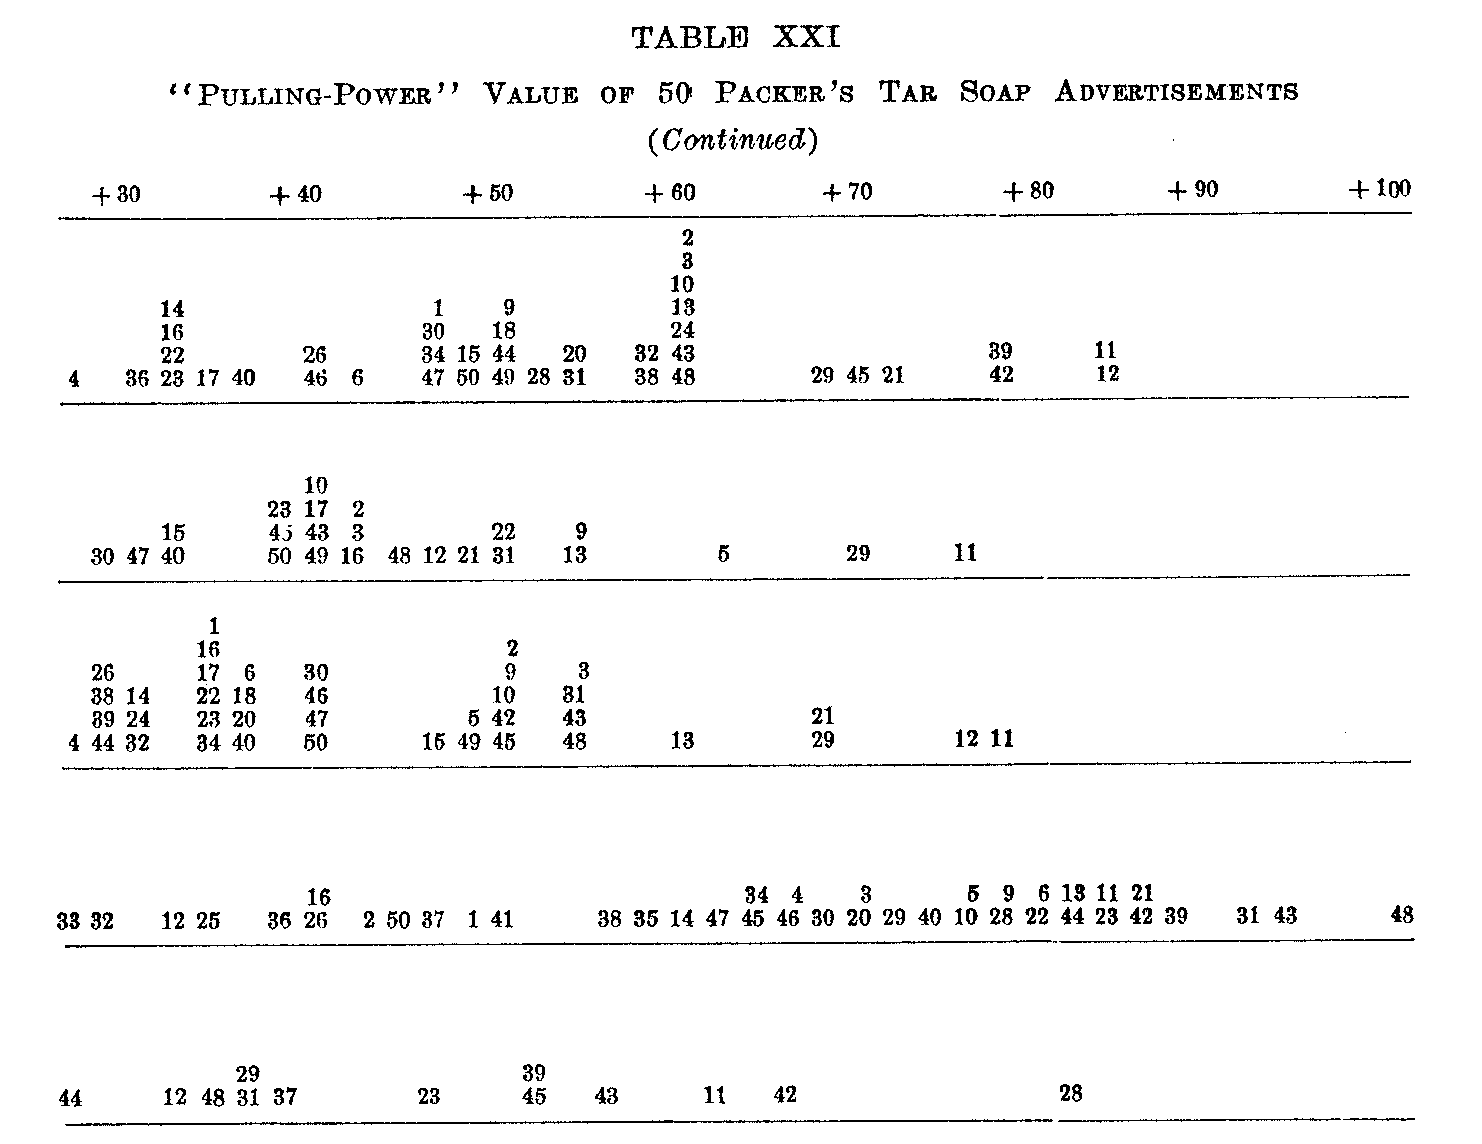
(69) "no-appeal" as zero, while the intervening advertisements were assigned proportionate values. It is scarcely necessary to repeat that the results of the Packer Manufacturing Co. are not based upon carefully compiled data but only upon the judgment of the firm based on their business experience. Any one familiar with advertising knows that such data have not been compiled for any extensive set of advertisements, let alone a series of fifty extending over twenty years of service. If such data did exist, they could not be used to their full face value, as an advertisement of twenty years ago might have been very effective then and be out of date to-day. The change of style of dress in the cut would alone seriously impair its value. The sixth section of this table gives the average position of each advertisement with the P.E. of that position from the arrangements of three advertising men in the Blackman-Ross Advertising Agency, which is now handling the Packer Manufacturing Co.'s business. Their arrangement was based on an "attention-value" basis instead of "appeal" or "pulling-power" value. Besides, each of the three men assigned values only to about one half of the fifty advertisements. The negative values which they assigned are much more reliable than the positive due to the fact that their attention was especially directed to the poor advertisements. The above five orders of preference are also shown in Table XXI.
All references to the order of preference of these fifty advertisements will be based on the median judgment, unless specially mentioned as based on the average, except with the order of preference of the three advertising men of the Blackman-Ross Agency where the average was used instead of the median. In this one case it was manifestly a fairer measure. Besides the reasons already mentioned in Chapter II. as to the superiority of the median over the average with data secured by the "order of merit method" we have here the difficulty of combining a set of data (from the 15 men) of very much less range or variability of judgment with one of great range (from the 10 women), especially in the negative direction. To average such data together is to give in a large number of cases very great value to one or two results far below the zero point, which, if anything, should be discounted. To reject such extreme variates as is done in many physical measurements, as for example under Chauvenet's criterion, 'would only defeat the object of this study. What is wanted is the position the majority of people would assign and not the average position of good, bad, and indifferent judges. This the median clearly gives. That there is no great difference in the relative order of the advertisements when determined by the aver-
(70)

-age judgment or by the median judgment is shown by the following three correlations:
Correlation between average and median judgment of the 15 men + .93
Correlation between average and median judgment of the 10 women + .89
Correlation between average and median judgment of the 25 subjects + .87
The higher ratings in Tables XX. and XXI. of the advertisements by the Packer Mfg. Co. are due simply to the fact that but one man rated them, while the lower ratings in the other columns are due to the fact that they represent the average of a number of ratings in which all did not agree as to the best advertisements.
The following advertisements were chosen for a study of the distribution of the judgments: No. 29 (64.1), No. 48 (54.4), No. 39 (44.4), No. 40 (34.2), No. 4 (24.4), No. 35 (13.9), No. 8 (2.2), and No. 19 (—5.9). The positions given here are based on the average judgment. The actual distribution of the judgments of these advertisements is shown in Table XXII. and parallel to it is shown the
(71)

theoretical distribution as determined with the use of a table of values of the normal probability integral corresponding to values of x/o. a in this case was obtained from the A.D. of the average of the twenty-five subjects (σ =1.25 A.D.). From the table it is clear that the distribution of judgments follows the probability curve distribution. With a larger number of cases the two would, no doubt, coincide. We may, therefore, assume that the various relationships of the normal curve of distribution hold throughout this series of judgments. (See Chapter II., Section 4, for a further study of these eight advertisements.)
Table XXIII. gives a number of correlations which indicate the resemblance between the five orders of preference of the fifty Packer's Tar Soap advertisements. None of these coefficients of correlation have been corrected for attenuation; hence the true coefficients are in every case somewhat higher than those given here.