Some Applications of Statistical Method to Political Research
Stuart A. Rice
Dartmouth College
This paper deals with the applicability of statistical principles and methods to research in political science. The subject is virgin and comprehensive. At the outset it will be necessary to delimit the treatment to be given it here, and to state some of the premises upon which this treatment will be based.
In the first place, the topic is unrelated to questions of public finance, or any of the bookkeeping aspects of government. I shall confine attention to more fundamental problems, distinctly psychological and sociological as well as political in character. These have to do with the nature and operation of forces that give rise to political activity and that determine its forms and its direction. A socio-political-psychology, quantitative in method, is the goal with respect to which orientation is sought.
In the second place, only data of a kind now available for research will be considered. Every statistician will agree with Professor Merriam's demand for the development and extension of governmental reporting, but my immediate concern is with undeveloped possibilities of utilizing existing materials.
In the third place, the desirability of a quantitative approach to political research problems is taken for granted. Yet the statistical method has serious limitations, not merely because it can never replace logic as a means of interpretation, but also because it is not universally available for scientific inquiry. The developments of recent years in the field of abnormal psychology, for example, have no quantitative method of discovery behind them. When subjective processes give rise to or accompany behavior, measurements of the latter may be possible. But these measurements are no more than indices of states of conscious or unconscious mental activity.
( 314)
The discovery of objective indices bearing upon the subject of inquiry is an important part of almost any research undertaking. For example, it was desired by the writer to determine the counties of maximum progressive or liberal opinion in Nebraska at the election of 1920. But progressive support was given both to Howell, Republican candidate for senator, and to Bryan, Democratic candidate for governor. The vote for neither alone provided an adequate index of progressivism because of the large element of party regularity in the vote for both. Hence progressivism was defined in terms of a tendency by the voters of both parties to split their ballots on behalf of the progressive candidate on the opposition ticket. An "index of progressivism." was obtained by averaging for every county the percentage of the senatorial vote received by Howell with the percentage of the gubernatorial vote received by Bryan. In much the same way, one of my students, Mr. Francis Wilder, now at the University of North Carolina, has sought to obtain an index of what he calls "political alertness" for the various counties of that state. Regarding independent voting as a measure of alertness, he has aggregated the differences on both party tickets between the vote cast for president and for governor and between that cast for governor and for United States senator. The sum of these four differentials in each county has then been related as a percentage to the total vote for president, governor, and United States senator combined, the result giving an index of the type sought.
I shall not pursue this matter further, but shall assume that indices of greater or less suitability may be found for many subjective phenomena. Political statistics, then, must be limited to forms of phenomena that are themselves measureable, or for which measureable indices may be obtained.
As a fourth limitation, I shall confine discussion to phenomena which may be treated as variable. The statistics of attributes, dealing with data which differ in kind rather than in degree, is sometimes held to apply with peculiar force to the field of politics -with its votes of "aye" and "no", with its victories of either one candidate or another. The writer has elsewhere advanced reasons for contending that even so discrete a phenomenon as a vote "aye"
( 315) or "no" really indicates a variable along a scale, so far as the opinion behind the vote is concerned.[1] A vote, in other words, is a behavioristic index, crude and discrete in form, of a subjective variable. Moreover, even though the individual vote be a discontinuous datum, the collective vote of a social group or a geographic area, regarded as the unit of attention, becomes itself a variable-in quantity, in distribution among candidates or between opposing issues, and in other important respects.
The four limitations already stated pertain to the subject matter of research. A fifth and final consideration involves the statistical methodology to be employed.
If one were to base an opinion upon the titles of the books on statistics now in circulation, he would infer that a great deal of specialization in statistical methodology has taken place. There are, for example, books on business statistics, educational statistics, and so on. It is to be borne in mind that in all such cases the principles and methods employed are essentially the same. Theoretical statistics really falls within the province of the mathematician. It is only the applications which differ, as one passes, say, from business to education. The educator, being unfamiliar with problems of business, and on the other hand having special problems and a special terminology of his own, finds it more convenient to discuss methods of finding averages or variability in terms of the data with which he is familiar. In a similar manner there is need of a "political statistics." But its principles and methods will in all important respects be the same as those which are utilized in their statistical calculations by the psychologist, the business forecaster, the public health administrator, or the meteorologist.
The primary task of the present paper, then, is to show the applicability to political science research, within the limits that have been described above, of statistical principles and methods that are already in common use in other fields of inquiry. The burden of this task can best be carried by means of illustra-
( 316) -tions, which will be taken, except as otherwise noted, from the writer's own research.
Individuals of homogeneous type present a variety of variable and comparable characteristics. Thus individuals of the type "male student of Zeta College" may be compared in the characteristics of height, weight, intelligence, academic rating, length of nose, distance of home residence from the college, or chest expansion. All of the individual measurements of one characteristic, considered independently of the others, constitute a series of mass phenomena susceptible of summary statistical description.
Of such a series at least four questions, important for interpretation of the phenomena, may be asked : First, are the individual measurements distributed about some point or points of concentration? Second, is there a representative value or average which for a given purpose may be used in place of the individual measurements collectively? Third, do the individual measurements differ widely or narrowly from each other; that is, what is the extent or the degree of the aggregate variability among them? Fourth, do individual values in one series tend to vary concomitantly with corresponding values in other series? The latter question, involving correlation, is important in the discovery of causal relationships.
From this point onward I shall attempt to show that all of these four questions arise in connection with political research problems and that statistical methods are therefore needed in their solution.
Many human characteristics are distributed normally. Suppose, for example, that the heights of Zeta college students are ascertained to the nearest inch, and that the data is then plotted on coördinate paper. The variable, height, will be indicated by intervals of distance from the point of origin along the base line. The number of men at each interval may be shown by ordinates erected according to a vertical scale of frequencies. If the tops of these ordinates be connected and the resulting line be smoothed, an approximation to the bell-shaped mathematical curve known as the curve of error will result. This is an important fact, because upon it much refined statistical analysis may be based, including prediction concerning the heights of students not included in the
( 317) data. If political phenomena tend to be distributed in similar manner, it will be evident that some beginning of statistical pre-diction concerning these phenomena will be possible. Let us examine the data provided by a particular research problem.
I am working with election returns which reflect the so-called radicalism or progressivism of some of the middle-western states. In particular, I am seeking to discover whether the attitudes and
opinions involved tend to diffuse or spread in the characteristic manner posited by the American school of anthropologists of culture traits in general.2 As a corollary, I am trying to learn in the case of these attitudes whether, as Wissler contends,[3] political boundaries interpose little or no obstacle to the diffusion of culture
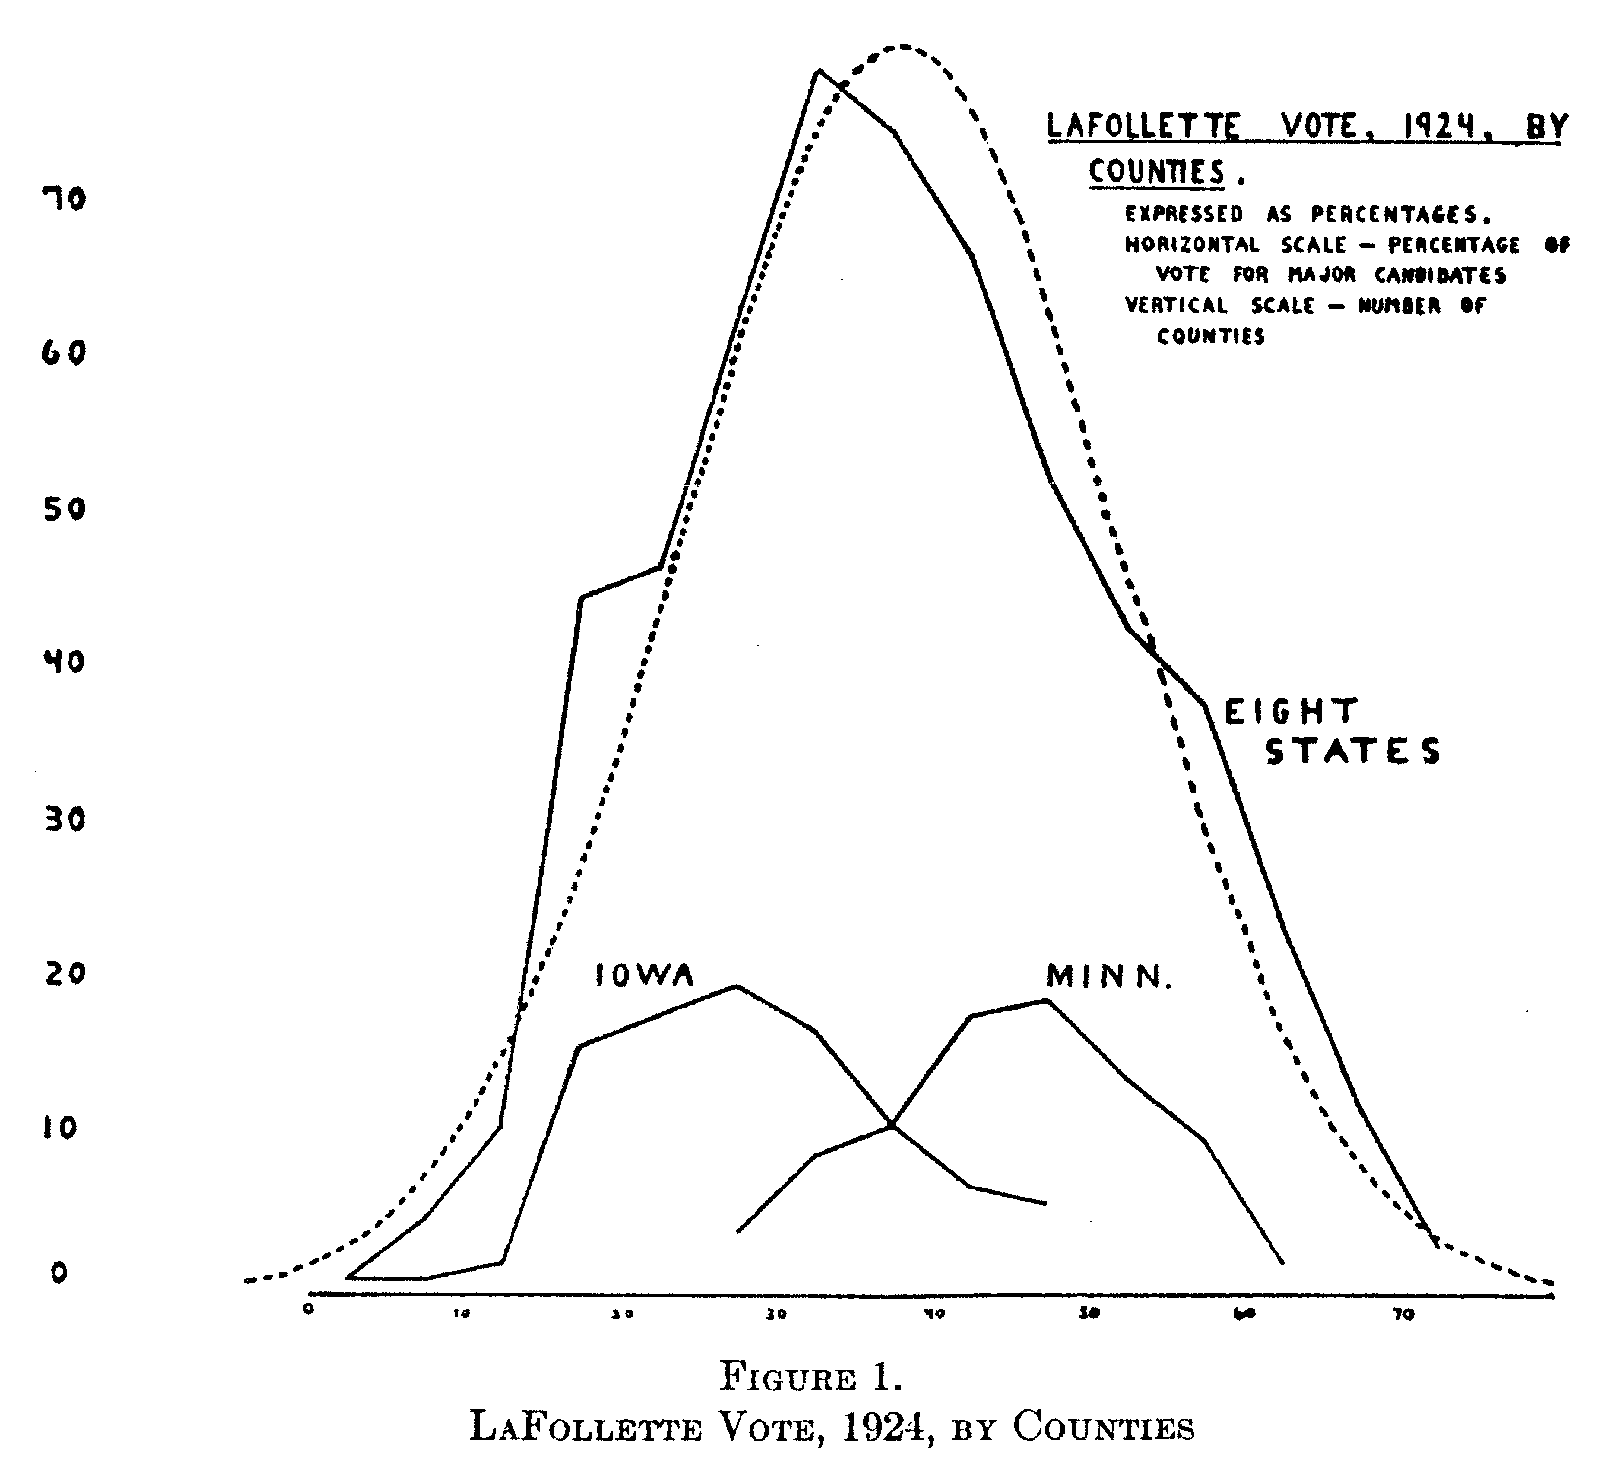
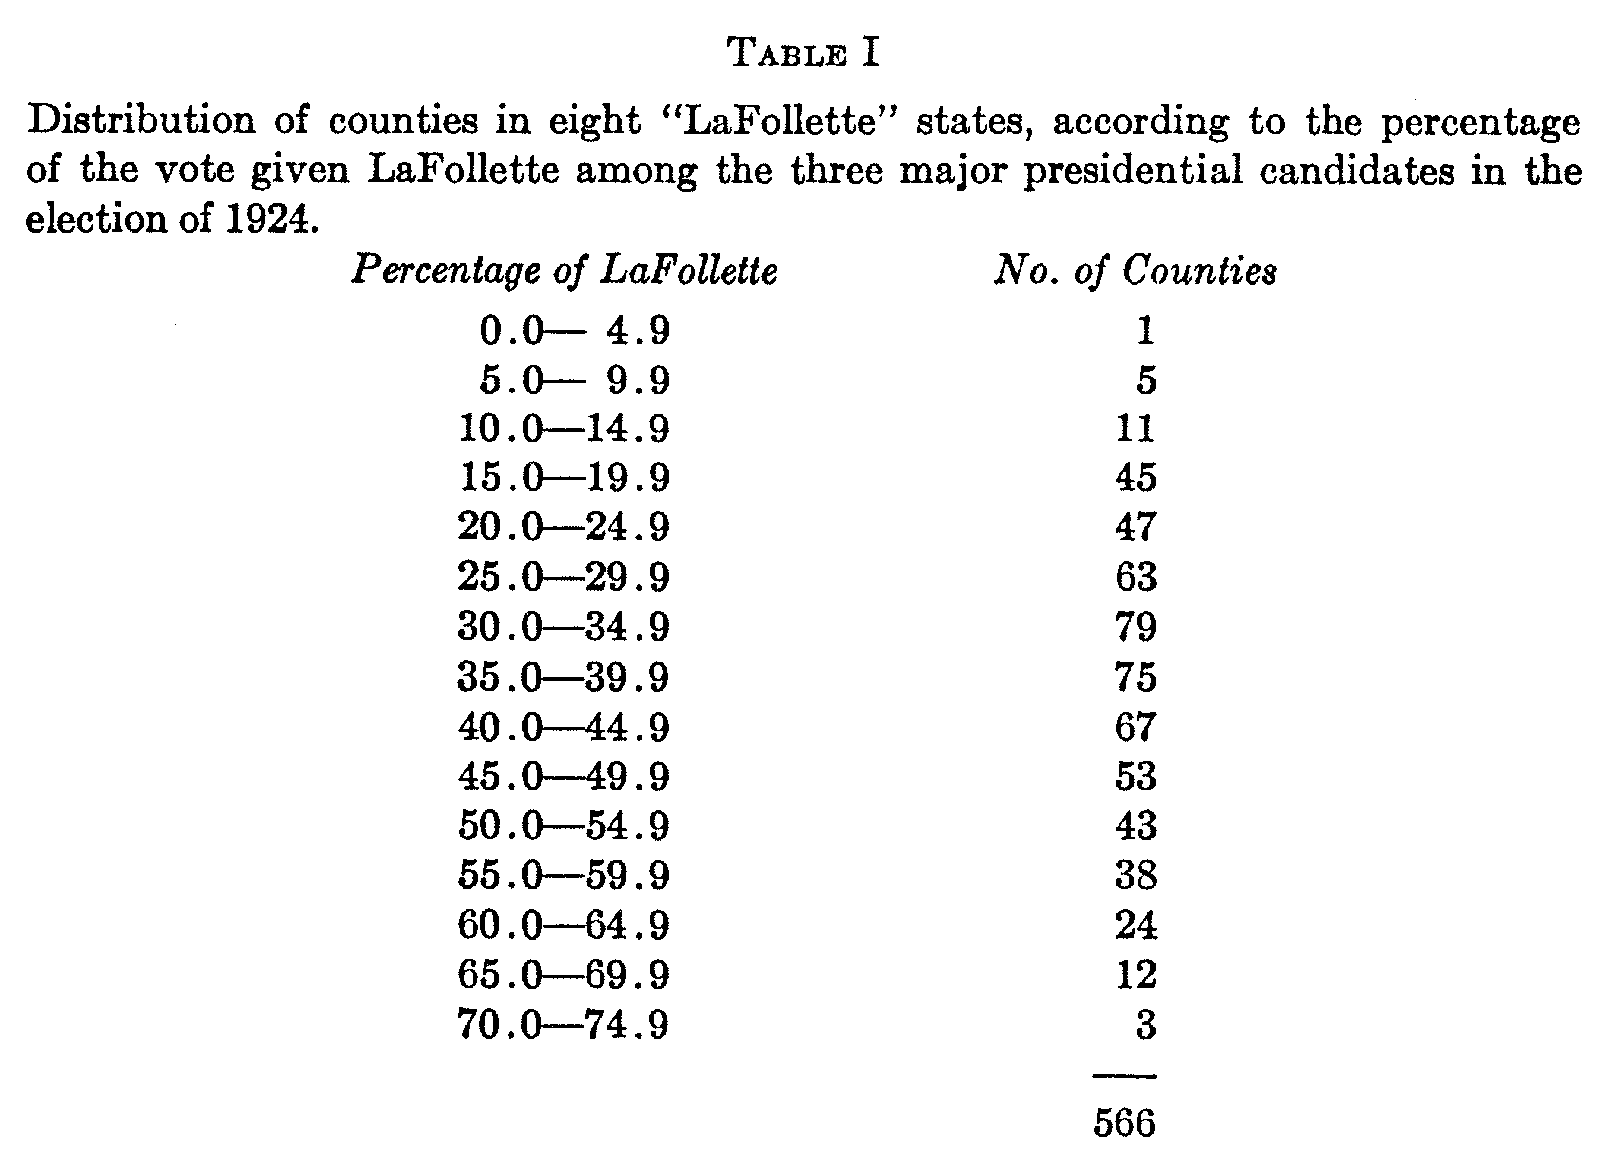
( 318) elements. As an index I have taken the LaFollette vote for president in the election of 1924, relating it as a percentage to the total vote for the three major candidates. The county has been adopted as the unit for this purpose. The results of these inquiries are not of concern at the moment. The point of present interest is that when the counties of these states are arrayed according to the degree of support given to LaFollette, their distribution, while somewhat "skewed," approximates in form the same normal frequency curve which will describe the heights of Zeta College men. This is shown in Figure 1. The large irregular curve represents the 566 counties of Wisconsin, Minnesota, Iowa, North Dakota, South Dakota, Nebraska, Montana, and Idaho, distributed according to the percentage of the LaFollette vote. These are states in which the candidate was held to have a chance of victory. The broken bell-shaped curve which roughly synchronizes with this represents the distribution that would be mathematically normal for the same data. The two smaller curves represent the actual distribution for the counties of Iowa and Minnesota respectively. The distribution for the eight states aggregated is shown in Table I.
(319)
"LaFollette sentiment," as indicated by the LaFollette vote, then, is found to be distributed normally, or approximately so, among the counties in a wide geographical area which was generally favorable to his cause. What was the most representative expression of LaFollettism among these counties? The percentage of the LaFollette vote over the area as a whole does not answer this question because of the wide differences of population. Resort must be had to a procedure which is often illegitimate, namely, the averaging of the individual percentages. For the 566 counties of the eight states under examination the three averages in most common use are found to be as follows : arithmetic mean, 37.9 per cent; median, 37.1 per cent; mode, 35.5 per cent. The relatively close correspondence between these three average values again confirms the normality of the distribution. Any one of the three gives a closer representation of the usual or typical county situation than does a single percentage which uses the state or the region as a base.
Having calculated average values, one of these may be used from which to measure variability. The concept of variability itself may be illustrated. Assume that the men of Zeta College possess a mean height of 68 inches, and that we wish to compare their heights with those of the members of a circus troupe. The latter will include a number of midgets and several side-show giants. The average height of the circus may turn out to be the same as that of the Zeta students, namely 68 inches. Yet it is obvious that the two groups differ widely in the extent to which the individuals in each approach the average height. That is, they differ in variability. Similarly, it is possible that of two states giving approximately the same support to LaFollette so far as aggregate returns are concerned, one may have the favorable attitude quite evenly spread over the entire state, while in the other LaFollette sentiment may be strongly developed in some counties and substantially absent from others.
To take an actual case, the variation in the percentage of LaFollette votes in the state of Montana is from 15.0 in Meagher County to 67.3 in Mineral. The range is thus 52.3 per cent, or more than half of the possible variation. In Minnesota, although
( 320) there are half again as many counties as in Montana, the range of variation is but two-thirds as great. It extends from 25.7 in Rice County to 64.6 in Pennington. The range is 38.9 per cent. It might be suspected that certain factors connected with the social or economic homogeneity of the two states, with the comparative extent of their areas, or with their facilities for communication, had something to do with the greater homogeneity in radical opinion that is indicated in Minnesota.
The range, however, is an inadequate measure of variability. For accuracy of comparison, we must utilize measures which take account of the values of all of the individual measurements. This necessitates the calculation for each state of either the average deviation or the standard deviation, and the reduction of either of these to a coefficient of variation. The latter permits of the direct comparison as to variability of series having different kinds of units or, as in the present case, similar units but averages of differing value.
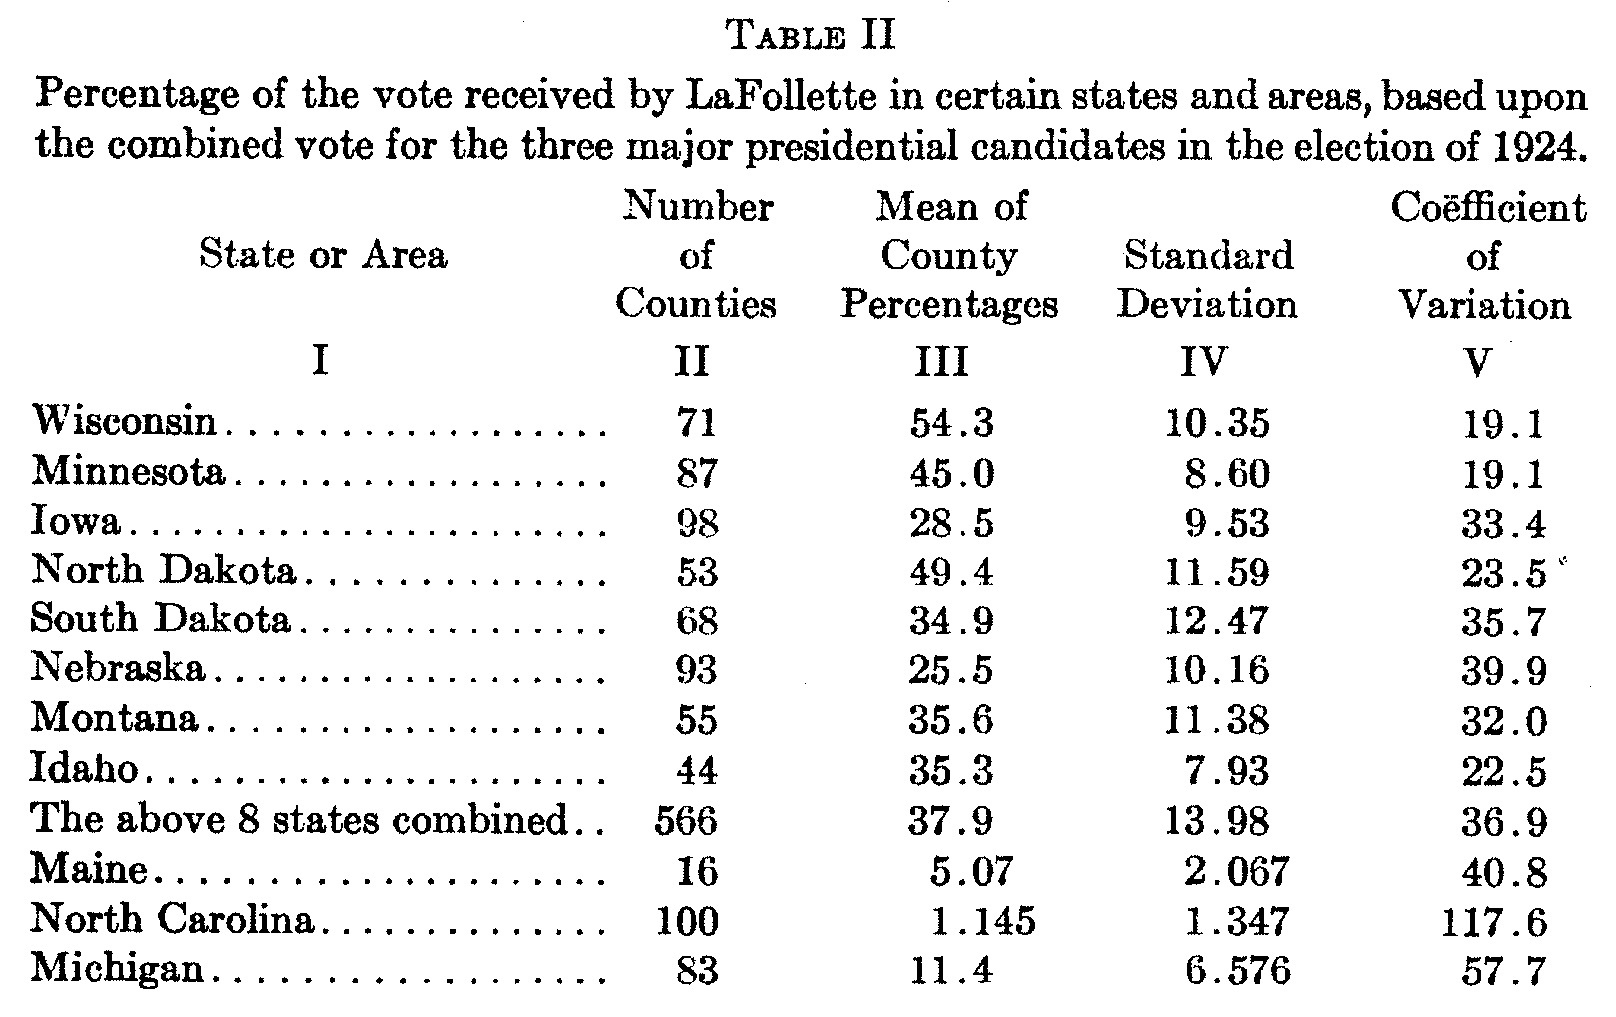
Using the same data as before concerning the LaFollette vote, coefficients of variation have been calculated for a number of individual states, including Michigan, Maine, and North Carolina, and the eight states previously mentioned in which his prospects
( 321) were regarded as favorable, together with the combined area of the latter. These are included in Table II. It should be remembered that a low coefficient of variation is indicative of a high degree of homogeneity with respect to the LaFollette vote.[4]
The table is suggestive. In Wisconsin and Minnesota, where LaFollette sentiment was strongly developed, the coefficient of variation was in each case 19.1 per cent. In Michigan, where the candidate was somewhat less successful than in the country at large, it was 57.7 per cent. In North Carolina, where LaFollette support was practically confined to isolated railroad centers, it was 117.6 per cent. In Idaho, a state in which geographical and cultural homogeneity are strikingly low, the coefficient was 22.5 per cent; while in Iowa, which is exceptionally homogeneous in the same respects, it was 33.4. In both of the latter states LaFollette received moderately strong support, although this support was stronger in Idaho.
These figures indicate that LaFollette strength was positively related to low relative variability among these percentages. It is not clear whether this relationship is due to anything more than the fact that the coefficient of variation is itself a function both of the standard deviation and the mean.[5] If there is a relationship in addition to that involved in this dependence, it would suggest that economic and social homogeneity may not be so essential for the diffusion of political attitudes as is the strong development of the latter at the points from which they spread. It is possible that an equation could be calculated from data of this sort which would express what might be called the velocity of diffusion, as a function of the comparative degree to which the attitude had already been accepted. The relationship, assuming its existence, might be expected to prove non-linear, the velocity accelerating up to a certain point., after which deceleration would set in.[6]
( 322) The meaning and use of the coefficient of variation in such a connection are not sufficiently understood to give more than suggestive value to such a hypothesis here. I confine myself at this point merely to suggesting one direction in which statistical methods of determining variability may yet throw light upon an important social and political phenomenon.
I come now to the last of the four types of questions which statistical methods enable us to answer concerning variable series, namely, those concerning correlation. The problem is, whether political science research requires the use of correlation methods, and again I shall endeavor to demonstrate by illustration that it does.
In one type of case we are interested in concomitant variation among the individual measures in two series which are static in character. For example, some of my students have been seeking to learn whether the percentage of LaFollette votes in 1924, a static variable by counties or other minor political units, is correlated, positively or negatively, with such variables as the
( 323) percentage of voters of German birth or extraction, the per capita farm values in agricultural districts, and farm tenancy and farm mortgaging. That is, we have sought for explanation of the LaFollette movement in various presumed causes of nationalistic or economic discontent. Again, by use of the questionnaire method, we have endeavored to rate the comparative radicalism of certain state legislators,[7] and relate this, in turn, to the radical proclivities of the various districts represented, with the LaFollette vote as an index of the latter. The effort here has been to test the "representativeness" of state legislators.
In another type of inquiry what is sought is a measure of the relationship between two series of data, each of which varies over a period of time.
Variations in such data may be due to one or another of four types of causes. There are, first, those factors whose influence operates with a degree of constancy, or a degree of constant change, over a relatively long period of years. The effects of these factors, when isolated, give rise to what is termed "secular trend." There are, next, those which result in cycles of several years duration, giving rise, when isolated and plotted, to a more or less wave-like curve about the line of trend. Third, there are frequently seasonal influences, causing a somewhat rhythmic pulse within the yearly period. Lastly, there are fortuitous factors like the World War, unassociated with the trend, the cycle, or with seasonality. The methods of correlation may reveal certain regularities of relationship in the seasonal or the cyclical variations of two time series; but it is first necessary to segregate the effects upon the data of the four types of influences just named. The determination of any one of the four may be an important end in itself.
It is obvious that political opinion offers few, if any, indices of a sort from which seasonality could be determined if it exists. Even data from which annual indices of opinion may be derived are none too frequent. I shall attempt, however, to demonstrate
( 324) that long term, or "secular," trends and cycles do exist in certain political phenomena, and are susceptible of statistical analysis.
For experimental purposes, I have developed a number of series of data, each of which may be regarded as providing a reflection in some degree of political opinion. Several of these have been based upon the vote of Assembly candidates in New Jersey, from 1877 to 1924 inclusive. This is a state in which annual elections are held, in which Assembly candidates have usually run for office under the banner of a recognized party, and in which the vote for the individual party designees has been officially recorded in the state Legislative Manual during the period named.
For each year, aggregating the vote for individual candidates in the twenty-one counties, I have computed on several bases the percentages of the votes which were cast for Republican candidates, for Democratic candidates, and for minor party candidates. The fact that these percentages refer to the aggregate vote for a number of candidates tends to neutralize the effect of personal popularity or unpopularity in the case of individuals. The result is a truer indication of the party vote in each year than would be, say, the vote for governor, president, or congressmen. It was felt that the changing percentages of Republican votes, with reference to the combined Republican and Democratic votes, let us say, would be some indication of what is sometimes called the pendulum of political opinion. The changing percentages of the minor party votes, with reference to the total of all parties, would give some index of the growth or subsidence of dissent from both of the major party organizations.
These series have been treated in the usual manner, trends being determined empirically according as a straight line or a parabola of lower or higher degree seemed to provide the "best fit."[8] One methodological problem was presented by the consistent increase of the Republican vote, both absolutely and relatively, in the quadrennial presidential elections. In the derivation of cycle figures correction was made for this tendency by the calculation of what I have called in my notes an index of
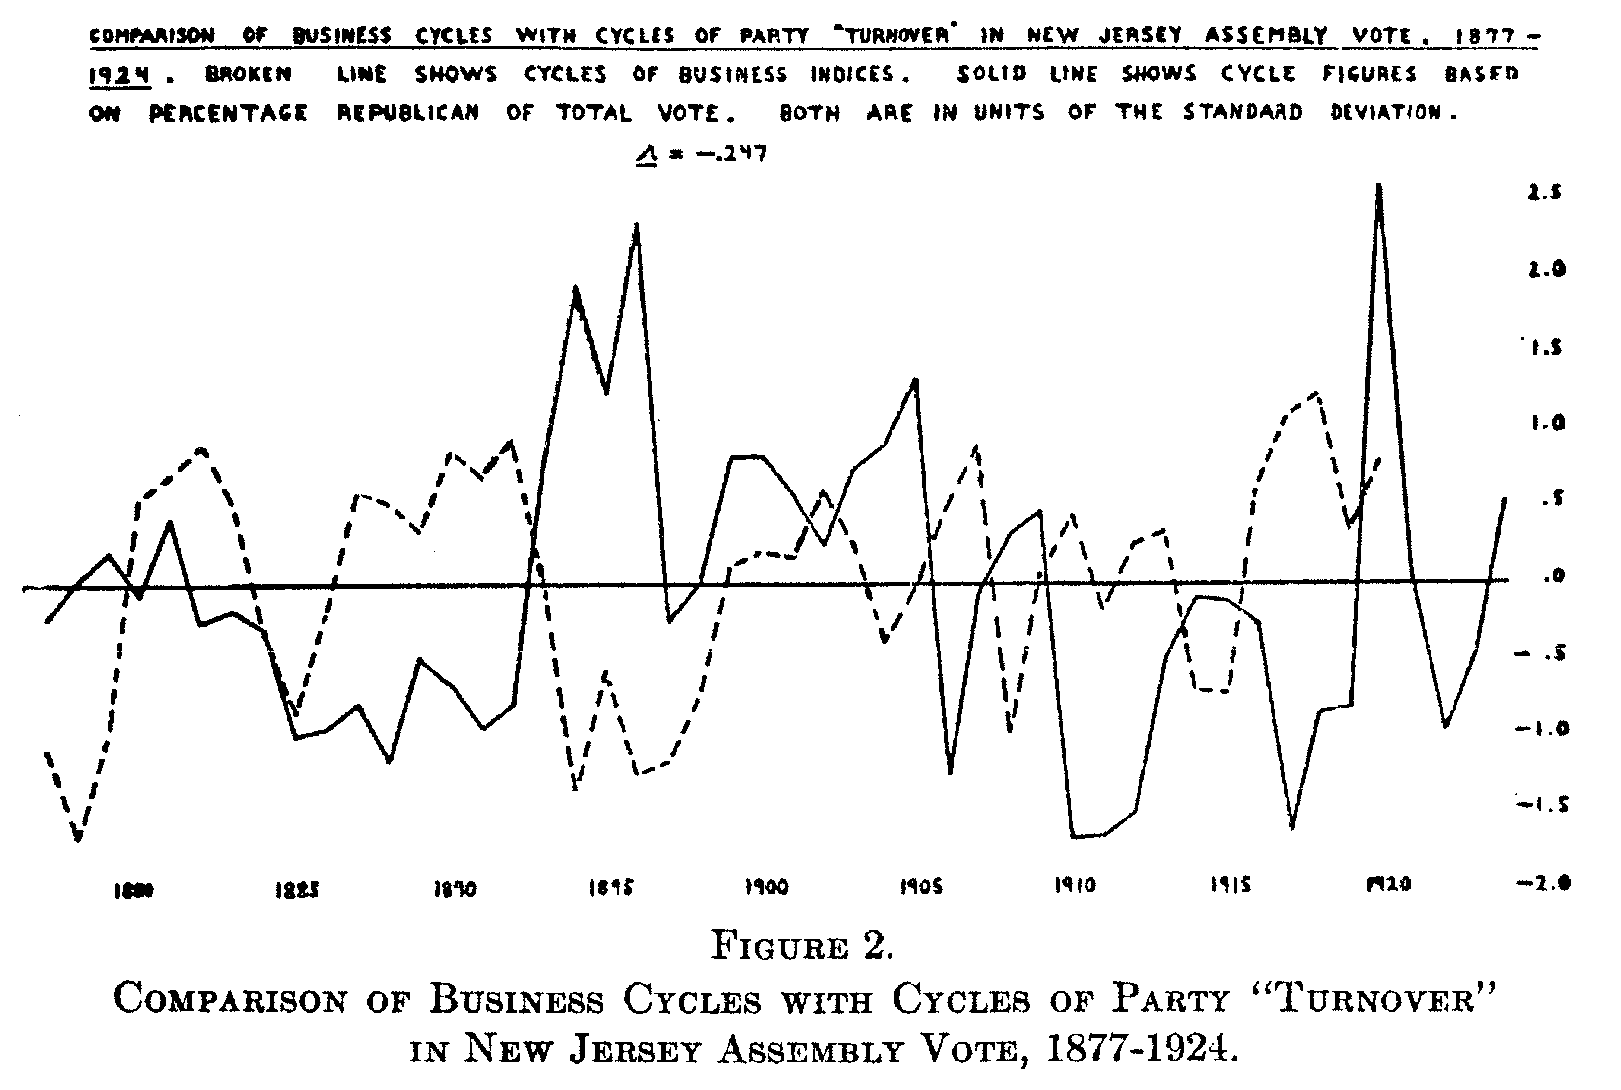
( 325) quadrennial variation. The method employed in obtaining the latter was similar to that which has been used by Professor Warren M. Persons in making correction for seasonality.[9] Without going into further discussion concerning these particular series, I may say that fairly well-defined trends and cycles appear in some of them, even apart from the quadrennial influence, but that no very significant correlation has yet been found to exist between the cycles disclosed and cycles in other series of social and economic data. The highest coefficient of correlation that has been obtained is that between the corrected cycle figures for the percentage Republican of the total vote and the cycles of business indices used by Ogburn and Thomas.[10] Without lead or lag, this was -.247. The curves representing the two series of cycle figures are shown in Figure 2. No light has been thrown in general, therefore, upon the causes of these political changes.
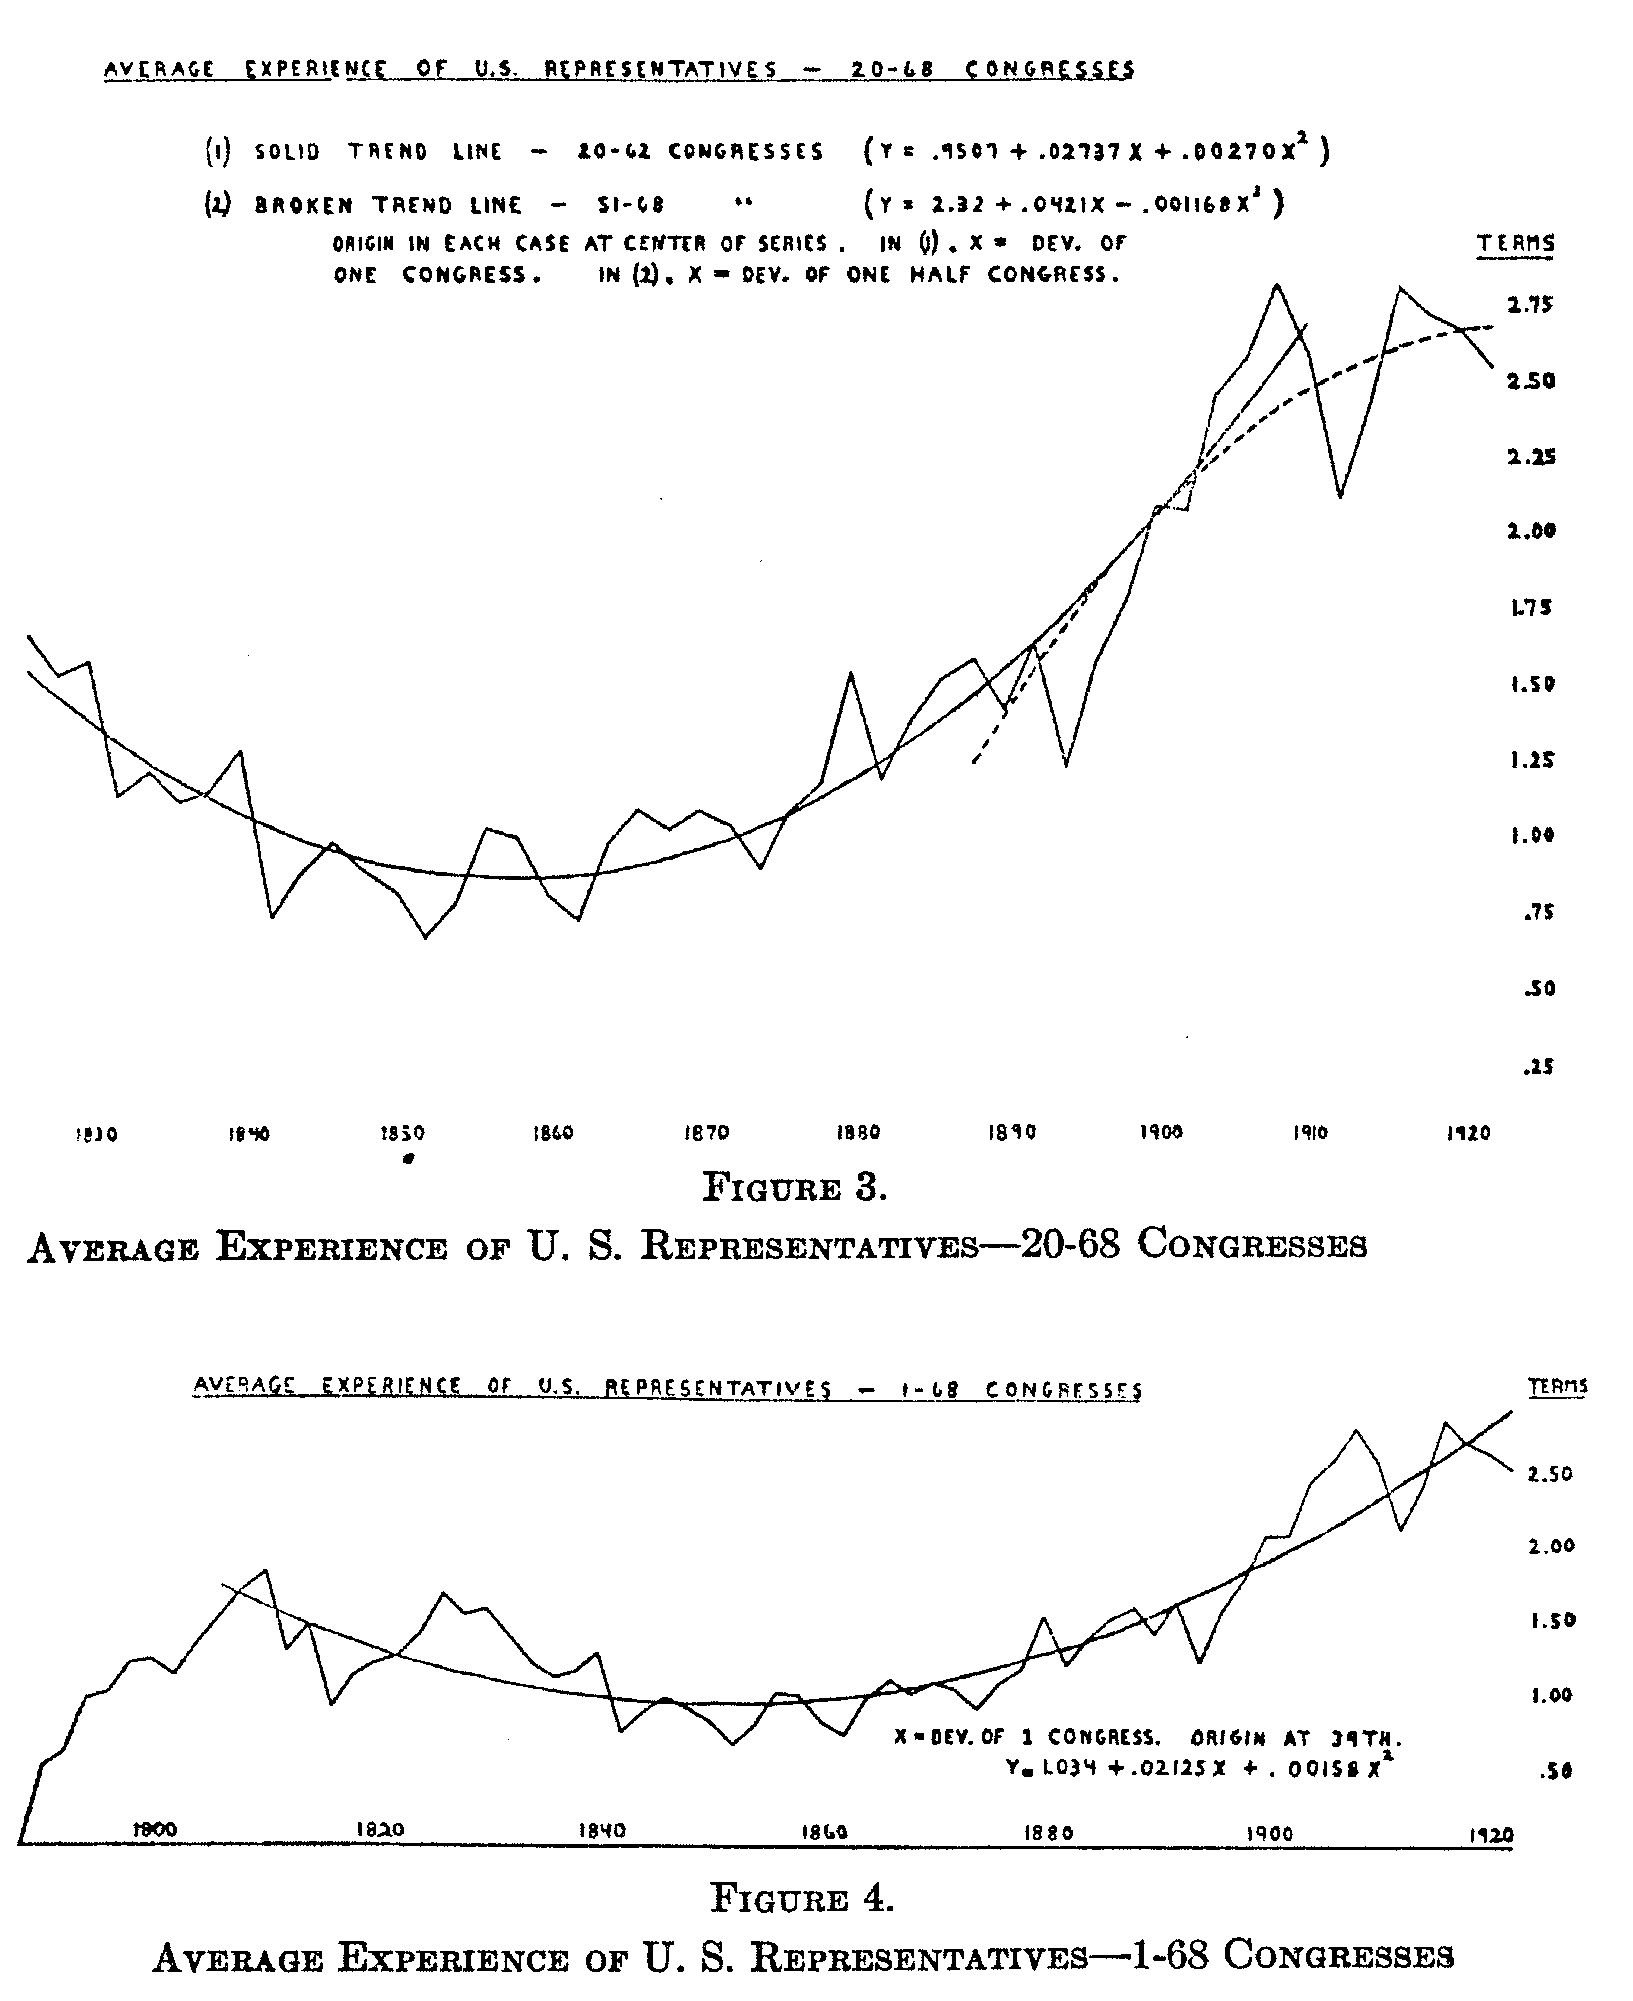
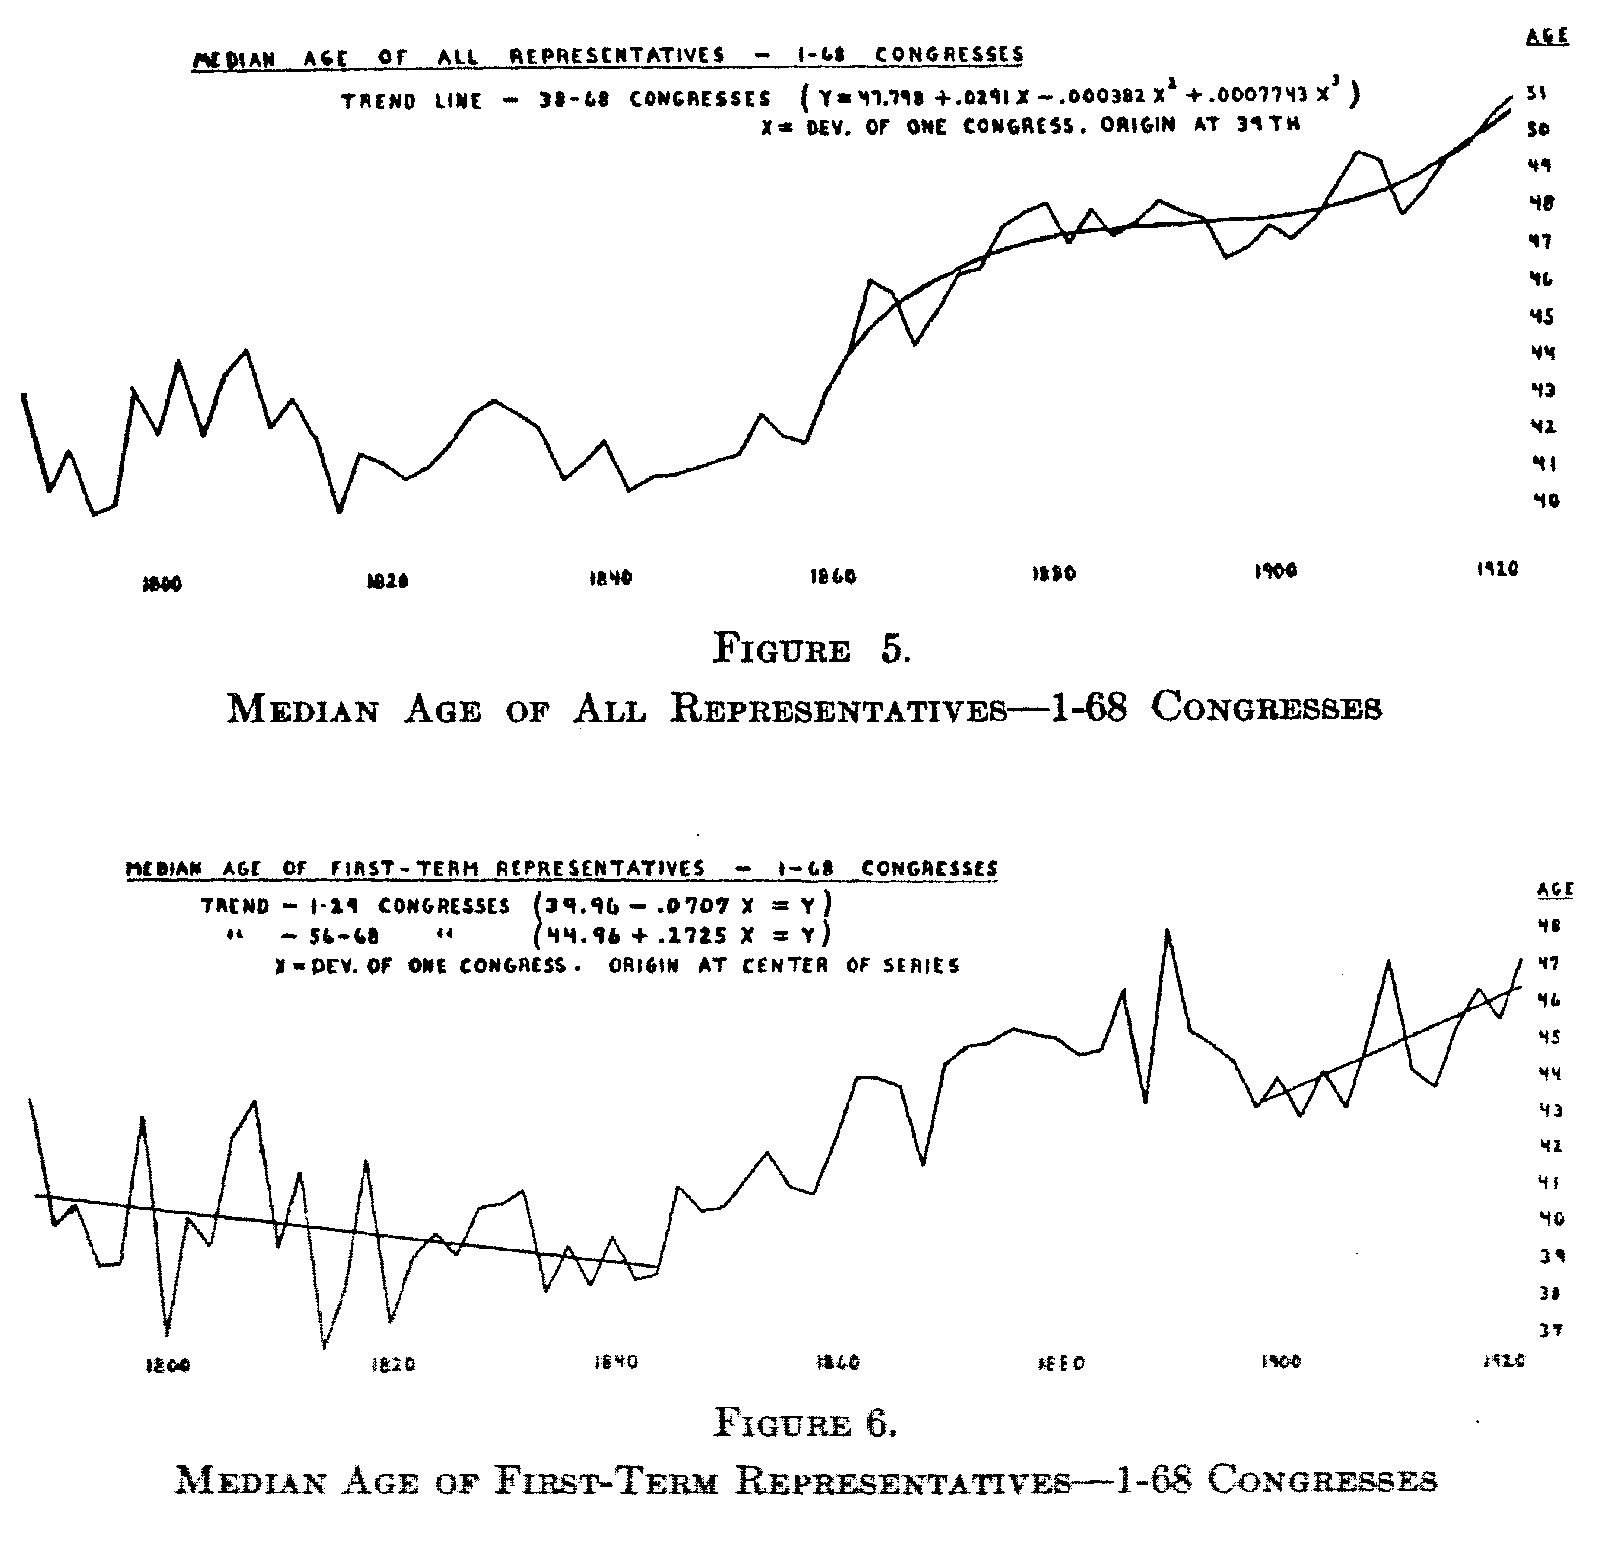
Four other series have been based upon biennial rather than upon annual determinations. I have ascertained (1) the median
( 326) age of all members of the United States House of Representatives from the First to the Sixty-eighth Congress inclusive; (2) the median age of the members serving their first term in each of these Congresses; (3) the percentage of members in each session serving a first term; and (4) the average experience of the members of the House in each Congress. In calculating the latter, the numbers of terms previously served by members at the beginning of each biennial period have been added, and the total divided by the number of members.[11] Other series could be constructed from the variability among the members' age or experience during the several sessions.
The Congressional Directory has provided the necessary data for recent sessions. For the period prior to the Sixty-Second Congress, they were taken from the ten or twelve thousand individual biographies contained in the Biographical Congressional Directory.[12]
To none of these series has it been found feasible to fit curves covering the entire period of one hundred and thirty-six years. Good fits in most cases have been obtained, however, by breaking the series into smaller segments. The lines connecting the original plottings, together with fitted curves and their equations, are shown for several of the series in Figures 3 to 6.
It is apparent that down to the Civil War period there were trends in the direction of electing younger men to Congress and retaining members there for shorter periods of time. From the Civil War period onward the age of first-term members has in-creased, reaching especially high averages with the men elected in 1890, 1910, and 1922. With this change came about a tendency to leave congressmen in office for longer periods of service. As would be expected, there has resulted a greatly increased average age of all members. As to the causes of these changes, the lengthening expectation of life is perhaps an important factor, but one for which no statistical allowance has yet been made. The opinion may be hazarded that another factor has been a
( 327) gradual departure from the Jacksonian type of democratic sentiment which prevailed during the time when the curves were trending downward. As to the results of these changes, no sta-
tistical statement can be made. It seems obvious from an a priori standpoint that increasing age and increasing average tenure of
( 328) service would both be influences making for conservatism in legislation.
Once more it must be pointed out that while the existence of trends susceptible of description by mathematical equations, and the existence of cycles about these trends (as shown in the accompanying charts), seem demonstrable, significant correlationswith other economic and social data have not yet been discovered. One exception may be noted. For the variable "average experience," I have fitted a parabolic trend line, concave down-
ward, for the sessions from the Fifty-first to the Sixty-eighth inclusive, that is, from the elections of 1889 to 1923. With the biennial deviations about this line, I have correlated figures
( 328) representing the mean of the business cycle figures used by Ogburn and Thomas for the corresponding year and the year preceding. This has given me a positive coefficient of correlation of .449, suggesting some relationship between business prosperity and the state of mind in the electorate which results in the reelection of experienced congressional incumbents.
To sum up, this paper has aimed at demonstrating some of the possibilities of
applying statistical principles and methods to political phenomena. In the
illustrations used, I have not been concerned with stating the results of
statistical inquiry in any single direction, but rather with exhibiting some
methods of statistical attack upon problems of political and social psychology
with which I have been personally concerned. My greatest hope is that I may have
succeeded in clearing a little of the ground upon which the development of
political statistics may proceed.